Jordanian vs Immigrants from Cabo Verde In Labor Force | Age 20-64
COMPARE
Jordanian
Immigrants from Cabo Verde
In Labor Force | Age 20-64
In Labor Force | Age 20-64 Comparison
Jordanians
Immigrants from Cabo Verde
80.1%
IN LABOR FORCE | AGE 20-64
97.2/ 100
METRIC RATING
85th/ 347
METRIC RANK
80.3%
IN LABOR FORCE | AGE 20-64
99.0/ 100
METRIC RATING
55th/ 347
METRIC RANK
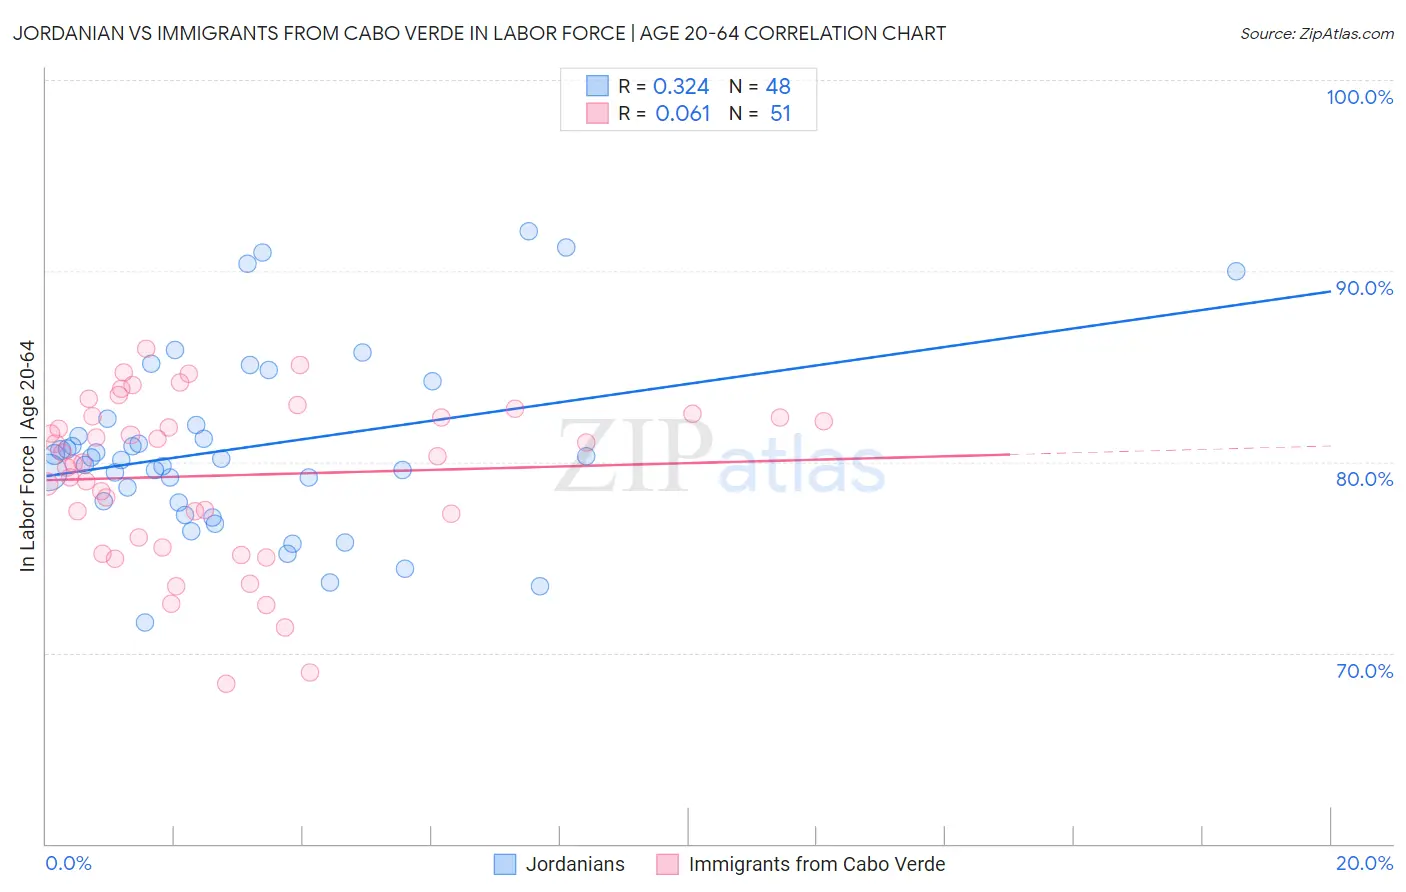
Jordanian vs Immigrants from Cabo Verde In Labor Force | Age 20-64 Correlation Chart
The statistical analysis conducted on geographies consisting of 166,422,649 people shows a mild positive correlation between the proportion of Jordanians and labor force participation rate among population between the ages 20 and 64 in the United States with a correlation coefficient (R) of 0.324 and weighted average of 80.1%. Similarly, the statistical analysis conducted on geographies consisting of 38,158,316 people shows a slight positive correlation between the proportion of Immigrants from Cabo Verde and labor force participation rate among population between the ages 20 and 64 in the United States with a correlation coefficient (R) of 0.061 and weighted average of 80.3%, a difference of 0.22%.
In Labor Force | Age 20-64 Correlation Summary
| Measurement | Jordanian | Immigrants from Cabo Verde |
| Minimum | 71.6% | 68.4% |
| Maximum | 92.1% | 85.9% |
| Range | 20.5% | 17.5% |
| Mean | 80.7% | 79.3% |
| Median | 80.2% | 80.3% |
| Interquartile 25% (IQ1) | 77.9% | 76.0% |
| Interquartile 75% (IQ3) | 82.1% | 82.4% |
| Interquartile Range (IQR) | 4.2% | 6.4% |
| Standard Deviation (Sample) | 4.7% | 4.3% |
| Standard Deviation (Population) | 4.7% | 4.2% |
Similar Demographics by In Labor Force | Age 20-64
Demographics Similar to Jordanians by In Labor Force | Age 20-64
In terms of in labor force | age 20-64, the demographic groups most similar to Jordanians are Immigrants from Egypt (80.1%, a difference of 0.0%), Croatian (80.1%, a difference of 0.0%), German Russian (80.1%, a difference of 0.010%), Immigrants from Japan (80.1%, a difference of 0.010%), and Colombian (80.1%, a difference of 0.010%).
| Demographics | Rating | Rank | In Labor Force | Age 20-64 |
| Immigrants | Romania | 97.8 /100 | #78 | Exceptional 80.2% |
| Asians | 97.7 /100 | #79 | Exceptional 80.2% |
| Immigrants | Croatia | 97.6 /100 | #80 | Exceptional 80.1% |
| German Russians | 97.3 /100 | #81 | Exceptional 80.1% |
| Immigrants | Japan | 97.3 /100 | #82 | Exceptional 80.1% |
| Colombians | 97.3 /100 | #83 | Exceptional 80.1% |
| Immigrants | Latvia | 97.2 /100 | #84 | Exceptional 80.1% |
| Jordanians | 97.2 /100 | #85 | Exceptional 80.1% |
| Immigrants | Egypt | 97.1 /100 | #86 | Exceptional 80.1% |
| Croatians | 97.1 /100 | #87 | Exceptional 80.1% |
| Chileans | 97.0 /100 | #88 | Exceptional 80.1% |
| Immigrants | Venezuela | 96.8 /100 | #89 | Exceptional 80.1% |
| Poles | 96.8 /100 | #90 | Exceptional 80.1% |
| Uruguayans | 96.7 /100 | #91 | Exceptional 80.1% |
| Ghanaians | 96.7 /100 | #92 | Exceptional 80.1% |
Demographics Similar to Immigrants from Cabo Verde by In Labor Force | Age 20-64
In terms of in labor force | age 20-64, the demographic groups most similar to Immigrants from Cabo Verde are Immigrants from Northern Africa (80.3%, a difference of 0.010%), Afghan (80.3%, a difference of 0.010%), Peruvian (80.3%, a difference of 0.020%), Serbian (80.3%, a difference of 0.030%), and Swedish (80.3%, a difference of 0.030%).
| Demographics | Rating | Rank | In Labor Force | Age 20-64 |
| Immigrants | Hong Kong | 99.5 /100 | #48 | Exceptional 80.4% |
| Immigrants | Greece | 99.4 /100 | #49 | Exceptional 80.4% |
| Immigrants | Sudan | 99.4 /100 | #50 | Exceptional 80.4% |
| Immigrants | Sri Lanka | 99.3 /100 | #51 | Exceptional 80.4% |
| Turks | 99.2 /100 | #52 | Exceptional 80.3% |
| Immigrants | Peru | 99.2 /100 | #53 | Exceptional 80.3% |
| Peruvians | 99.1 /100 | #54 | Exceptional 80.3% |
| Immigrants | Cabo Verde | 99.0 /100 | #55 | Exceptional 80.3% |
| Immigrants | Northern Africa | 99.0 /100 | #56 | Exceptional 80.3% |
| Afghans | 98.9 /100 | #57 | Exceptional 80.3% |
| Serbians | 98.9 /100 | #58 | Exceptional 80.3% |
| Swedes | 98.9 /100 | #59 | Exceptional 80.3% |
| Tongans | 98.8 /100 | #60 | Exceptional 80.3% |
| Burmese | 98.8 /100 | #61 | Exceptional 80.3% |
| Carpatho Rusyns | 98.8 /100 | #62 | Exceptional 80.3% |