Jordanian vs Okinawan Single Father Households
COMPARE
Jordanian
Okinawan
Single Father Households
Single Father Households Comparison
Jordanians
Okinawans
2.2%
SINGLE FATHER HOUSEHOLDS
96.9/ 100
METRIC RATING
127th/ 347
METRIC RANK
1.9%
SINGLE FATHER HOUSEHOLDS
100.0/ 100
METRIC RATING
10th/ 347
METRIC RANK
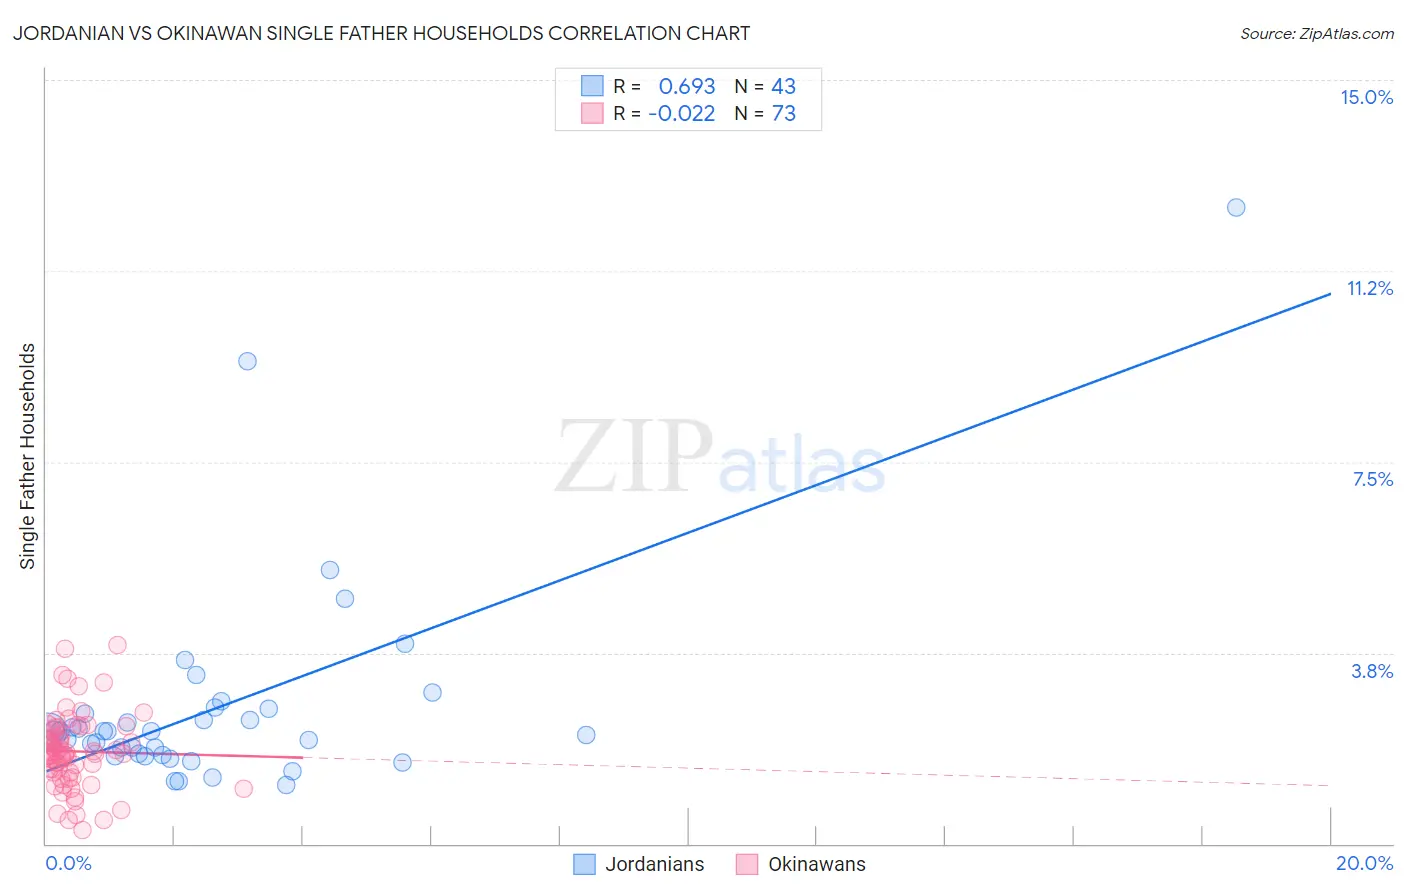
Jordanian vs Okinawan Single Father Households Correlation Chart
The statistical analysis conducted on geographies consisting of 165,930,664 people shows a significant positive correlation between the proportion of Jordanians and percentage of single father households in the United States with a correlation coefficient (R) of 0.693 and weighted average of 2.2%. Similarly, the statistical analysis conducted on geographies consisting of 73,621,147 people shows no correlation between the proportion of Okinawans and percentage of single father households in the United States with a correlation coefficient (R) of -0.022 and weighted average of 1.9%, a difference of 18.2%.
Single Father Households Correlation Summary
| Measurement | Jordanian | Okinawan |
| Minimum | 1.1% | 0.27% |
| Maximum | 12.5% | 3.9% |
| Range | 11.4% | 3.6% |
| Mean | 2.7% | 1.8% |
| Median | 2.2% | 1.8% |
| Interquartile 25% (IQ1) | 1.7% | 1.4% |
| Interquartile 75% (IQ3) | 2.6% | 2.3% |
| Interquartile Range (IQR) | 0.89% | 0.87% |
| Standard Deviation (Sample) | 2.1% | 0.73% |
| Standard Deviation (Population) | 2.0% | 0.72% |
Similar Demographics by Single Father Households
Demographics Similar to Jordanians by Single Father Households
In terms of single father households, the demographic groups most similar to Jordanians are Moroccan (2.2%, a difference of 0.0%), Immigrants from England (2.2%, a difference of 0.040%), Serbian (2.2%, a difference of 0.050%), Immigrants from Chile (2.2%, a difference of 0.17%), and Immigrants from Jordan (2.2%, a difference of 0.23%).
| Demographics | Rating | Rank | Single Father Households |
| Australians | 97.7 /100 | #120 | Exceptional 2.2% |
| Immigrants | Brazil | 97.7 /100 | #121 | Exceptional 2.2% |
| Immigrants | Iraq | 97.6 /100 | #122 | Exceptional 2.2% |
| Immigrants | Yemen | 97.5 /100 | #123 | Exceptional 2.2% |
| British West Indians | 97.4 /100 | #124 | Exceptional 2.2% |
| Immigrants | Indonesia | 97.4 /100 | #125 | Exceptional 2.2% |
| Moroccans | 96.9 /100 | #126 | Exceptional 2.2% |
| Jordanians | 96.9 /100 | #127 | Exceptional 2.2% |
| Immigrants | England | 96.8 /100 | #128 | Exceptional 2.2% |
| Serbians | 96.8 /100 | #129 | Exceptional 2.2% |
| Immigrants | Chile | 96.7 /100 | #130 | Exceptional 2.2% |
| Immigrants | Jordan | 96.6 /100 | #131 | Exceptional 2.2% |
| Poles | 96.5 /100 | #132 | Exceptional 2.2% |
| Taiwanese | 96.3 /100 | #133 | Exceptional 2.2% |
| Zimbabweans | 95.1 /100 | #134 | Exceptional 2.2% |
Demographics Similar to Okinawans by Single Father Households
In terms of single father households, the demographic groups most similar to Okinawans are Immigrants from Belarus (1.9%, a difference of 0.32%), Immigrants from China (1.8%, a difference of 0.36%), Immigrants from Ireland (1.8%, a difference of 0.50%), Cypriot (1.8%, a difference of 0.61%), and Immigrants from Taiwan (1.8%, a difference of 0.76%).
| Demographics | Rating | Rank | Single Father Households |
| Filipinos | 100.0 /100 | #3 | Exceptional 1.8% |
| Immigrants | Uzbekistan | 100.0 /100 | #4 | Exceptional 1.8% |
| Immigrants | Hong Kong | 100.0 /100 | #5 | Exceptional 1.8% |
| Immigrants | Taiwan | 100.0 /100 | #6 | Exceptional 1.8% |
| Cypriots | 100.0 /100 | #7 | Exceptional 1.8% |
| Immigrants | Ireland | 100.0 /100 | #8 | Exceptional 1.8% |
| Immigrants | China | 100.0 /100 | #9 | Exceptional 1.8% |
| Okinawans | 100.0 /100 | #10 | Exceptional 1.9% |
| Immigrants | Belarus | 100.0 /100 | #11 | Exceptional 1.9% |
| Immigrants | Greece | 100.0 /100 | #12 | Exceptional 1.9% |
| Immigrants | Singapore | 100.0 /100 | #13 | Exceptional 1.9% |
| Immigrants | Lithuania | 100.0 /100 | #14 | Exceptional 1.9% |
| Immigrants | Eastern Asia | 100.0 /100 | #15 | Exceptional 1.9% |
| Immigrants | Iran | 100.0 /100 | #16 | Exceptional 1.9% |
| Immigrants | India | 100.0 /100 | #17 | Exceptional 1.9% |