Ute vs Irish Average Family Size
COMPARE
Ute
Irish
Average Family Size
Average Family Size Comparison
Ute
Irish
3.49
AVERAGE FAMILY SIZE
100.0/ 100
METRIC RATING
16th/ 347
METRIC RANK
3.10
AVERAGE FAMILY SIZE
0.0/ 100
METRIC RATING
336th/ 347
METRIC RANK
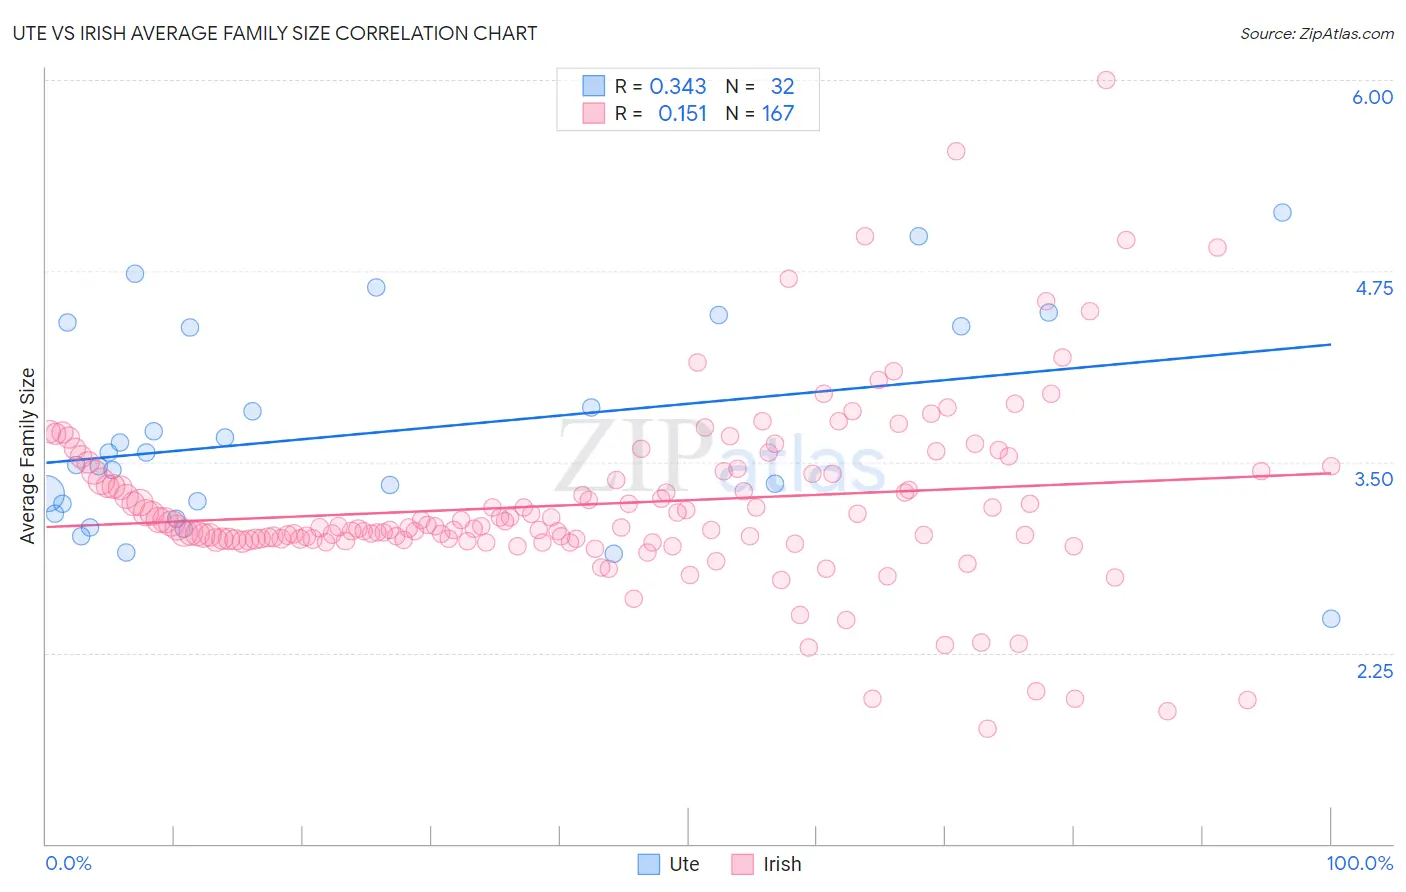
Ute vs Irish Average Family Size Correlation Chart
The statistical analysis conducted on geographies consisting of 55,658,636 people shows a mild positive correlation between the proportion of Ute and average family size in the United States with a correlation coefficient (R) of 0.343 and weighted average of 3.49. Similarly, the statistical analysis conducted on geographies consisting of 580,016,096 people shows a poor positive correlation between the proportion of Irish and average family size in the United States with a correlation coefficient (R) of 0.151 and weighted average of 3.10, a difference of 12.6%.
Average Family Size Correlation Summary
| Measurement | Ute | Irish |
| Minimum | 2.47 | 1.75 |
| Maximum | 5.13 | 6.00 |
| Range | 2.66 | 4.25 |
| Mean | 3.69 | 3.22 |
| Median | 3.52 | 3.08 |
| Interquartile 25% (IQ1) | 3.19 | 2.99 |
| Interquartile 75% (IQ3) | 4.38 | 3.43 |
| Interquartile Range (IQR) | 1.19 | 0.44 |
| Standard Deviation (Sample) | 0.67 | 0.59 |
| Standard Deviation (Population) | 0.66 | 0.59 |
Similar Demographics by Average Family Size
Demographics Similar to Ute by Average Family Size
In terms of average family size, the demographic groups most similar to Ute are Tongan (3.49, a difference of 0.060%), Immigrants from El Salvador (3.49, a difference of 0.090%), Immigrants from Central America (3.49, a difference of 0.11%), Salvadoran (3.48, a difference of 0.34%), and Mexican (3.48, a difference of 0.40%).
| Demographics | Rating | Rank | Average Family Size |
| Hopi | 100.0 /100 | #9 | Exceptional 3.60 |
| Spanish American Indians | 100.0 /100 | #10 | Exceptional 3.58 |
| Tohono O'odham | 100.0 /100 | #11 | Exceptional 3.53 |
| Immigrants | Mexico | 100.0 /100 | #12 | Exceptional 3.52 |
| Sioux | 100.0 /100 | #13 | Exceptional 3.52 |
| Immigrants | Central America | 100.0 /100 | #14 | Exceptional 3.49 |
| Tongans | 100.0 /100 | #15 | Exceptional 3.49 |
| Ute | 100.0 /100 | #16 | Exceptional 3.49 |
| Immigrants | El Salvador | 100.0 /100 | #17 | Exceptional 3.49 |
| Salvadorans | 100.0 /100 | #18 | Exceptional 3.48 |
| Mexicans | 100.0 /100 | #19 | Exceptional 3.48 |
| Cheyenne | 100.0 /100 | #20 | Exceptional 3.47 |
| Yuman | 100.0 /100 | #21 | Exceptional 3.47 |
| Apache | 100.0 /100 | #22 | Exceptional 3.46 |
| Immigrants | Fiji | 100.0 /100 | #23 | Exceptional 3.45 |
Demographics Similar to Irish by Average Family Size
In terms of average family size, the demographic groups most similar to Irish are Swedish (3.10, a difference of 0.030%), Luxembourger (3.10, a difference of 0.060%), French (3.10, a difference of 0.060%), Croatian (3.10, a difference of 0.070%), and Estonian (3.10, a difference of 0.090%).
| Demographics | Rating | Rank | Average Family Size |
| Belgians | 0.0 /100 | #329 | Tragic 3.11 |
| Latvians | 0.0 /100 | #330 | Tragic 3.11 |
| Scotch-Irish | 0.0 /100 | #331 | Tragic 3.11 |
| Scottish | 0.0 /100 | #332 | Tragic 3.11 |
| Estonians | 0.0 /100 | #333 | Tragic 3.10 |
| Lithuanians | 0.0 /100 | #334 | Tragic 3.10 |
| Luxembourgers | 0.0 /100 | #335 | Tragic 3.10 |
| Irish | 0.0 /100 | #336 | Tragic 3.10 |
| Swedes | 0.0 /100 | #337 | Tragic 3.10 |
| French | 0.0 /100 | #338 | Tragic 3.10 |
| Croatians | 0.0 /100 | #339 | Tragic 3.10 |
| Finns | 0.0 /100 | #340 | Tragic 3.09 |
| Poles | 0.0 /100 | #341 | Tragic 3.09 |
| Germans | 0.0 /100 | #342 | Tragic 3.09 |
| Norwegians | 0.0 /100 | #343 | Tragic 3.08 |