Taiwanese vs Irish Average Family Size
COMPARE
Taiwanese
Irish
Average Family Size
Average Family Size Comparison
Taiwanese
Irish
3.23
AVERAGE FAMILY SIZE
54.2/ 100
METRIC RATING
168th/ 347
METRIC RANK
3.10
AVERAGE FAMILY SIZE
0.0/ 100
METRIC RATING
336th/ 347
METRIC RANK
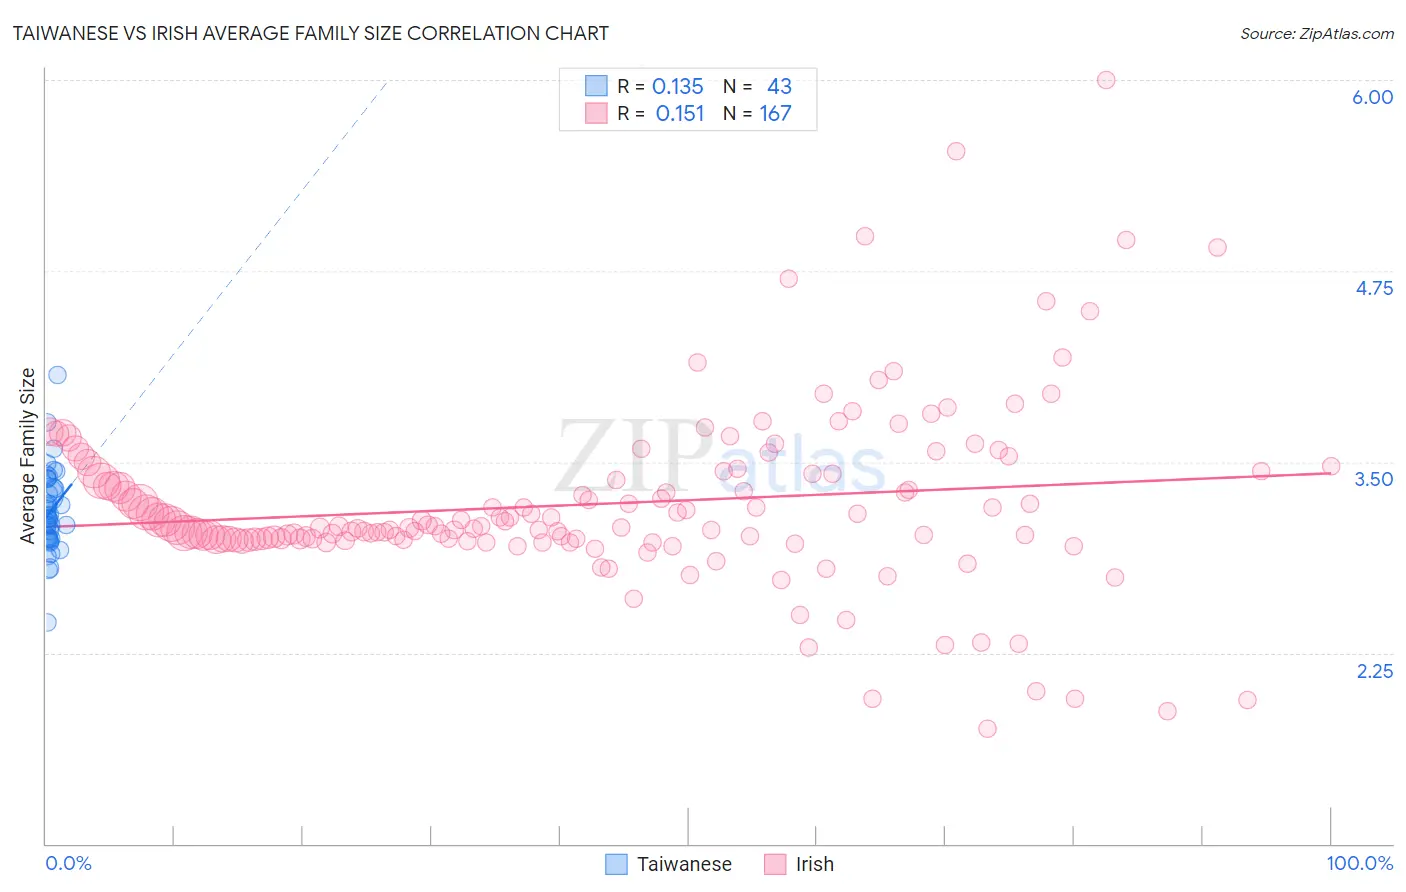
Taiwanese vs Irish Average Family Size Correlation Chart
The statistical analysis conducted on geographies consisting of 31,668,405 people shows a poor positive correlation between the proportion of Taiwanese and average family size in the United States with a correlation coefficient (R) of 0.135 and weighted average of 3.23. Similarly, the statistical analysis conducted on geographies consisting of 580,016,096 people shows a poor positive correlation between the proportion of Irish and average family size in the United States with a correlation coefficient (R) of 0.151 and weighted average of 3.10, a difference of 4.2%.
Average Family Size Correlation Summary
| Measurement | Taiwanese | Irish |
| Minimum | 2.45 | 1.75 |
| Maximum | 4.07 | 6.00 |
| Range | 1.62 | 4.25 |
| Mean | 3.18 | 3.22 |
| Median | 3.13 | 3.08 |
| Interquartile 25% (IQ1) | 3.00 | 2.99 |
| Interquartile 75% (IQ3) | 3.33 | 3.43 |
| Interquartile Range (IQR) | 0.33 | 0.44 |
| Standard Deviation (Sample) | 0.27 | 0.59 |
| Standard Deviation (Population) | 0.27 | 0.59 |
Similar Demographics by Average Family Size
Demographics Similar to Taiwanese by Average Family Size
In terms of average family size, the demographic groups most similar to Taiwanese are Aleut (3.23, a difference of 0.0%), Arab (3.23, a difference of 0.010%), Chilean (3.23, a difference of 0.020%), Immigrants from Congo (3.23, a difference of 0.030%), and Immigrants from Uruguay (3.23, a difference of 0.040%).
| Demographics | Rating | Rank | Average Family Size |
| Immigrants | Chile | 63.2 /100 | #161 | Good 3.24 |
| Immigrants | Uganda | 60.1 /100 | #162 | Good 3.23 |
| Uruguayans | 58.8 /100 | #163 | Average 3.23 |
| Egyptians | 58.6 /100 | #164 | Average 3.23 |
| Ugandans | 58.4 /100 | #165 | Average 3.23 |
| Immigrants | Senegal | 57.5 /100 | #166 | Average 3.23 |
| Dutch West Indians | 56.9 /100 | #167 | Average 3.23 |
| Taiwanese | 54.2 /100 | #168 | Average 3.23 |
| Aleuts | 54.1 /100 | #169 | Average 3.23 |
| Arabs | 53.8 /100 | #170 | Average 3.23 |
| Chileans | 53.2 /100 | #171 | Average 3.23 |
| Immigrants | Congo | 52.7 /100 | #172 | Average 3.23 |
| Immigrants | Uruguay | 52.0 /100 | #173 | Average 3.23 |
| Immigrants | South Central Asia | 50.0 /100 | #174 | Average 3.23 |
| Immigrants | China | 49.9 /100 | #175 | Average 3.23 |
Demographics Similar to Irish by Average Family Size
In terms of average family size, the demographic groups most similar to Irish are Swedish (3.10, a difference of 0.030%), Luxembourger (3.10, a difference of 0.060%), French (3.10, a difference of 0.060%), Croatian (3.10, a difference of 0.070%), and Estonian (3.10, a difference of 0.090%).
| Demographics | Rating | Rank | Average Family Size |
| Belgians | 0.0 /100 | #329 | Tragic 3.11 |
| Latvians | 0.0 /100 | #330 | Tragic 3.11 |
| Scotch-Irish | 0.0 /100 | #331 | Tragic 3.11 |
| Scottish | 0.0 /100 | #332 | Tragic 3.11 |
| Estonians | 0.0 /100 | #333 | Tragic 3.10 |
| Lithuanians | 0.0 /100 | #334 | Tragic 3.10 |
| Luxembourgers | 0.0 /100 | #335 | Tragic 3.10 |
| Irish | 0.0 /100 | #336 | Tragic 3.10 |
| Swedes | 0.0 /100 | #337 | Tragic 3.10 |
| French | 0.0 /100 | #338 | Tragic 3.10 |
| Croatians | 0.0 /100 | #339 | Tragic 3.10 |
| Finns | 0.0 /100 | #340 | Tragic 3.09 |
| Poles | 0.0 /100 | #341 | Tragic 3.09 |
| Germans | 0.0 /100 | #342 | Tragic 3.09 |
| Norwegians | 0.0 /100 | #343 | Tragic 3.08 |