Filipino vs Immigrants from Germany Single Mother Households
COMPARE
Filipino
Immigrants from Germany
Single Mother Households
Single Mother Households Comparison
Filipinos
Immigrants from Germany
4.7%
SINGLE MOTHER HOUSEHOLDS
100.0/ 100
METRIC RATING
2nd/ 347
METRIC RANK
6.1%
SINGLE MOTHER HOUSEHOLDS
72.4/ 100
METRIC RATING
161st/ 347
METRIC RANK
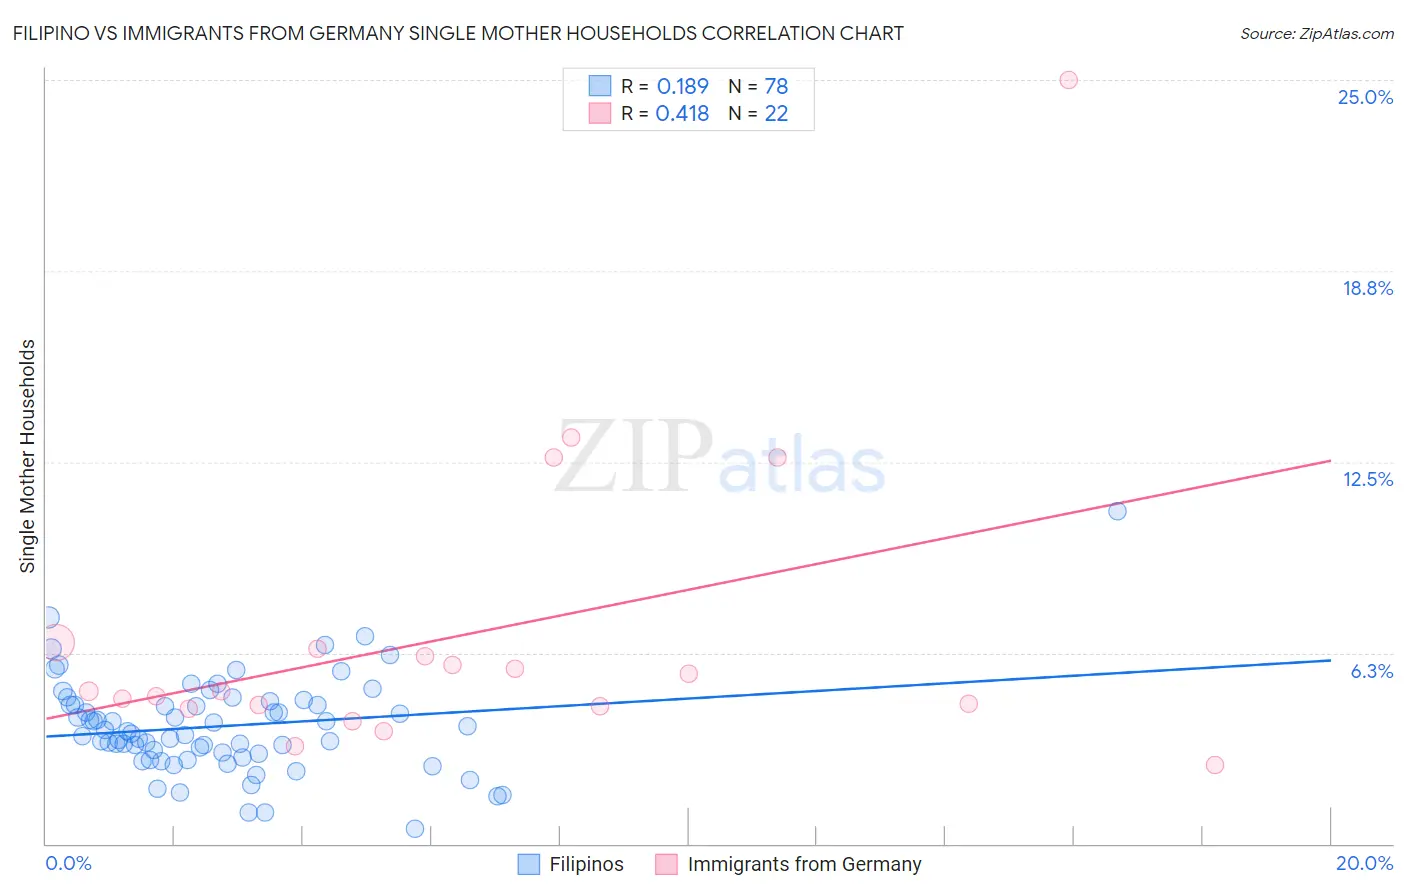
Filipino vs Immigrants from Germany Single Mother Households Correlation Chart
The statistical analysis conducted on geographies consisting of 253,859,207 people shows a poor positive correlation between the proportion of Filipinos and percentage of single mother households in the United States with a correlation coefficient (R) of 0.189 and weighted average of 4.7%. Similarly, the statistical analysis conducted on geographies consisting of 462,130,920 people shows a moderate positive correlation between the proportion of Immigrants from Germany and percentage of single mother households in the United States with a correlation coefficient (R) of 0.418 and weighted average of 6.1%, a difference of 30.8%.
Single Mother Households Correlation Summary
| Measurement | Filipino | Immigrants from Germany |
| Minimum | 0.51% | 2.6% |
| Maximum | 10.9% | 25.0% |
| Range | 10.4% | 22.4% |
| Mean | 3.8% | 6.9% |
| Median | 3.6% | 5.0% |
| Interquartile 25% (IQ1) | 2.9% | 4.5% |
| Interquartile 75% (IQ3) | 4.5% | 6.4% |
| Interquartile Range (IQR) | 1.6% | 1.9% |
| Standard Deviation (Sample) | 1.6% | 5.0% |
| Standard Deviation (Population) | 1.6% | 4.9% |
Similar Demographics by Single Mother Households
Demographics Similar to Filipinos by Single Mother Households
In terms of single mother households, the demographic groups most similar to Filipinos are Immigrants from Taiwan (4.7%, a difference of 0.30%), Immigrants from Iran (4.8%, a difference of 2.3%), Assyrian/Chaldean/Syriac (4.8%, a difference of 2.4%), Immigrants from Hong Kong (4.8%, a difference of 3.0%), and Immigrants from Singapore (5.0%, a difference of 5.6%).
| Demographics | Rating | Rank | Single Mother Households |
| Immigrants | Taiwan | 100.0 /100 | #1 | Exceptional 4.7% |
| Filipinos | 100.0 /100 | #2 | Exceptional 4.7% |
| Immigrants | Iran | 100.0 /100 | #3 | Exceptional 4.8% |
| Assyrians/Chaldeans/Syriacs | 100.0 /100 | #4 | Exceptional 4.8% |
| Immigrants | Hong Kong | 100.0 /100 | #5 | Exceptional 4.8% |
| Immigrants | Singapore | 100.0 /100 | #6 | Exceptional 5.0% |
| Iranians | 100.0 /100 | #7 | Exceptional 5.0% |
| Immigrants | Ireland | 99.9 /100 | #8 | Exceptional 5.0% |
| Okinawans | 99.9 /100 | #9 | Exceptional 5.0% |
| Immigrants | Israel | 99.9 /100 | #10 | Exceptional 5.0% |
| Immigrants | China | 99.9 /100 | #11 | Exceptional 5.1% |
| Cypriots | 99.9 /100 | #12 | Exceptional 5.1% |
| Immigrants | India | 99.9 /100 | #13 | Exceptional 5.1% |
| Immigrants | Australia | 99.9 /100 | #14 | Exceptional 5.1% |
| Immigrants | Eastern Asia | 99.9 /100 | #15 | Exceptional 5.1% |
Demographics Similar to Immigrants from Germany by Single Mother Households
In terms of single mother households, the demographic groups most similar to Immigrants from Germany are Iraqi (6.1%, a difference of 0.080%), Yugoslavian (6.1%, a difference of 0.090%), Celtic (6.1%, a difference of 0.13%), Chilean (6.1%, a difference of 0.27%), and Immigrants from Zimbabwe (6.2%, a difference of 0.34%).
| Demographics | Rating | Rank | Single Mother Households |
| Immigrants | Philippines | 78.5 /100 | #154 | Good 6.1% |
| Whites/Caucasians | 76.5 /100 | #155 | Good 6.1% |
| Native Hawaiians | 75.0 /100 | #156 | Good 6.1% |
| Chileans | 74.2 /100 | #157 | Good 6.1% |
| Celtics | 73.3 /100 | #158 | Good 6.1% |
| Yugoslavians | 73.1 /100 | #159 | Good 6.1% |
| Iraqis | 73.0 /100 | #160 | Good 6.1% |
| Immigrants | Germany | 72.4 /100 | #161 | Good 6.1% |
| Immigrants | Zimbabwe | 69.9 /100 | #162 | Good 6.2% |
| Alsatians | 68.7 /100 | #163 | Good 6.2% |
| Immigrants | Northern Africa | 68.0 /100 | #164 | Good 6.2% |
| Immigrants | Syria | 67.4 /100 | #165 | Good 6.2% |
| Sri Lankans | 63.9 /100 | #166 | Good 6.2% |
| Brazilians | 59.1 /100 | #167 | Average 6.2% |
| Immigrants | Chile | 58.3 /100 | #168 | Average 6.3% |