Immigrants from Uzbekistan vs Immigrants from Germany Single Mother Households
COMPARE
Immigrants from Uzbekistan
Immigrants from Germany
Single Mother Households
Single Mother Households Comparison
Immigrants from Uzbekistan
Immigrants from Germany
5.9%
SINGLE MOTHER HOUSEHOLDS
93.4/ 100
METRIC RATING
123rd/ 347
METRIC RANK
6.1%
SINGLE MOTHER HOUSEHOLDS
72.4/ 100
METRIC RATING
161st/ 347
METRIC RANK
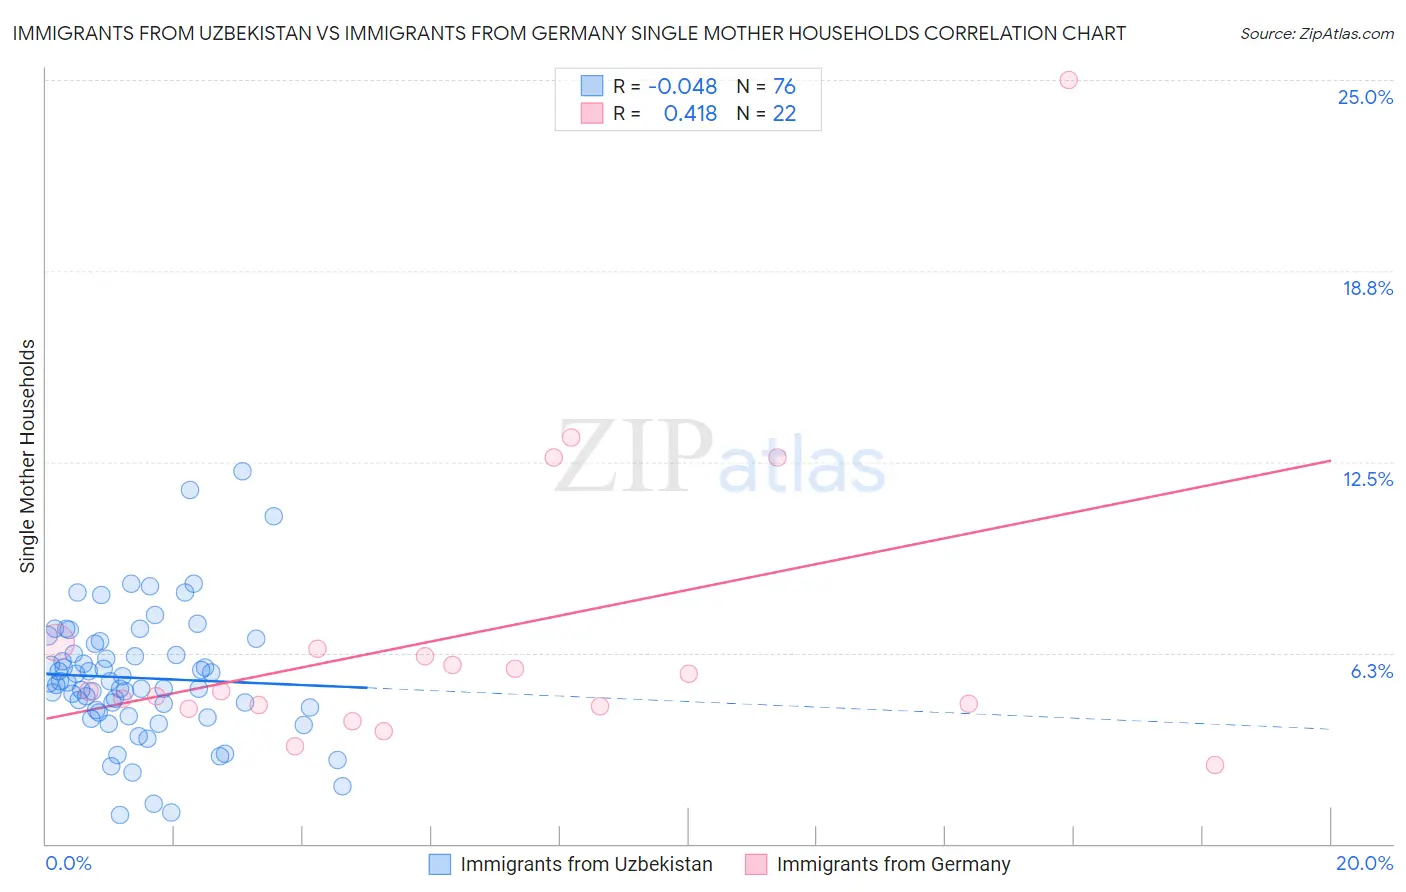
Immigrants from Uzbekistan vs Immigrants from Germany Single Mother Households Correlation Chart
The statistical analysis conducted on geographies consisting of 118,578,546 people shows no correlation between the proportion of Immigrants from Uzbekistan and percentage of single mother households in the United States with a correlation coefficient (R) of -0.048 and weighted average of 5.9%. Similarly, the statistical analysis conducted on geographies consisting of 462,130,920 people shows a moderate positive correlation between the proportion of Immigrants from Germany and percentage of single mother households in the United States with a correlation coefficient (R) of 0.418 and weighted average of 6.1%, a difference of 5.0%.
Single Mother Households Correlation Summary
| Measurement | Immigrants from Uzbekistan | Immigrants from Germany |
| Minimum | 0.94% | 2.6% |
| Maximum | 12.2% | 25.0% |
| Range | 11.3% | 22.4% |
| Mean | 5.4% | 6.9% |
| Median | 5.3% | 5.0% |
| Interquartile 25% (IQ1) | 4.3% | 4.5% |
| Interquartile 75% (IQ3) | 6.4% | 6.4% |
| Interquartile Range (IQR) | 2.1% | 1.9% |
| Standard Deviation (Sample) | 2.1% | 5.0% |
| Standard Deviation (Population) | 2.1% | 4.9% |
Similar Demographics by Single Mother Households
Demographics Similar to Immigrants from Uzbekistan by Single Mother Households
In terms of single mother households, the demographic groups most similar to Immigrants from Uzbekistan are Belgian (5.8%, a difference of 0.060%), Immigrants from Argentina (5.9%, a difference of 0.070%), Argentinean (5.8%, a difference of 0.14%), Tongan (5.8%, a difference of 0.17%), and Slavic (5.9%, a difference of 0.23%).
| Demographics | Rating | Rank | Single Mother Households |
| Pennsylvania Germans | 94.7 /100 | #116 | Exceptional 5.8% |
| Bolivians | 94.6 /100 | #117 | Exceptional 5.8% |
| Laotians | 94.3 /100 | #118 | Exceptional 5.8% |
| South Africans | 94.1 /100 | #119 | Exceptional 5.8% |
| Tongans | 93.7 /100 | #120 | Exceptional 5.8% |
| Argentineans | 93.7 /100 | #121 | Exceptional 5.8% |
| Belgians | 93.5 /100 | #122 | Exceptional 5.8% |
| Immigrants | Uzbekistan | 93.4 /100 | #123 | Exceptional 5.9% |
| Immigrants | Argentina | 93.2 /100 | #124 | Exceptional 5.9% |
| Slavs | 92.9 /100 | #125 | Exceptional 5.9% |
| Welsh | 92.8 /100 | #126 | Exceptional 5.9% |
| Lebanese | 92.4 /100 | #127 | Exceptional 5.9% |
| Czechoslovakians | 92.2 /100 | #128 | Exceptional 5.9% |
| Immigrants | Bolivia | 92.2 /100 | #129 | Exceptional 5.9% |
| Palestinians | 92.1 /100 | #130 | Exceptional 5.9% |
Demographics Similar to Immigrants from Germany by Single Mother Households
In terms of single mother households, the demographic groups most similar to Immigrants from Germany are Iraqi (6.1%, a difference of 0.080%), Yugoslavian (6.1%, a difference of 0.090%), Celtic (6.1%, a difference of 0.13%), Chilean (6.1%, a difference of 0.27%), and Immigrants from Zimbabwe (6.2%, a difference of 0.34%).
| Demographics | Rating | Rank | Single Mother Households |
| Immigrants | Philippines | 78.5 /100 | #154 | Good 6.1% |
| Whites/Caucasians | 76.5 /100 | #155 | Good 6.1% |
| Native Hawaiians | 75.0 /100 | #156 | Good 6.1% |
| Chileans | 74.2 /100 | #157 | Good 6.1% |
| Celtics | 73.3 /100 | #158 | Good 6.1% |
| Yugoslavians | 73.1 /100 | #159 | Good 6.1% |
| Iraqis | 73.0 /100 | #160 | Good 6.1% |
| Immigrants | Germany | 72.4 /100 | #161 | Good 6.1% |
| Immigrants | Zimbabwe | 69.9 /100 | #162 | Good 6.2% |
| Alsatians | 68.7 /100 | #163 | Good 6.2% |
| Immigrants | Northern Africa | 68.0 /100 | #164 | Good 6.2% |
| Immigrants | Syria | 67.4 /100 | #165 | Good 6.2% |
| Sri Lankans | 63.9 /100 | #166 | Good 6.2% |
| Brazilians | 59.1 /100 | #167 | Average 6.2% |
| Immigrants | Chile | 58.3 /100 | #168 | Average 6.3% |