African vs Canadian Single Mother Households
COMPARE
African
Canadian
Single Mother Households
Single Mother Households Comparison
Africans
Canadians
8.2%
SINGLE MOTHER HOUSEHOLDS
0.0/ 100
METRIC RATING
316th/ 347
METRIC RANK
5.9%
SINGLE MOTHER HOUSEHOLDS
90.5/ 100
METRIC RATING
134th/ 347
METRIC RANK
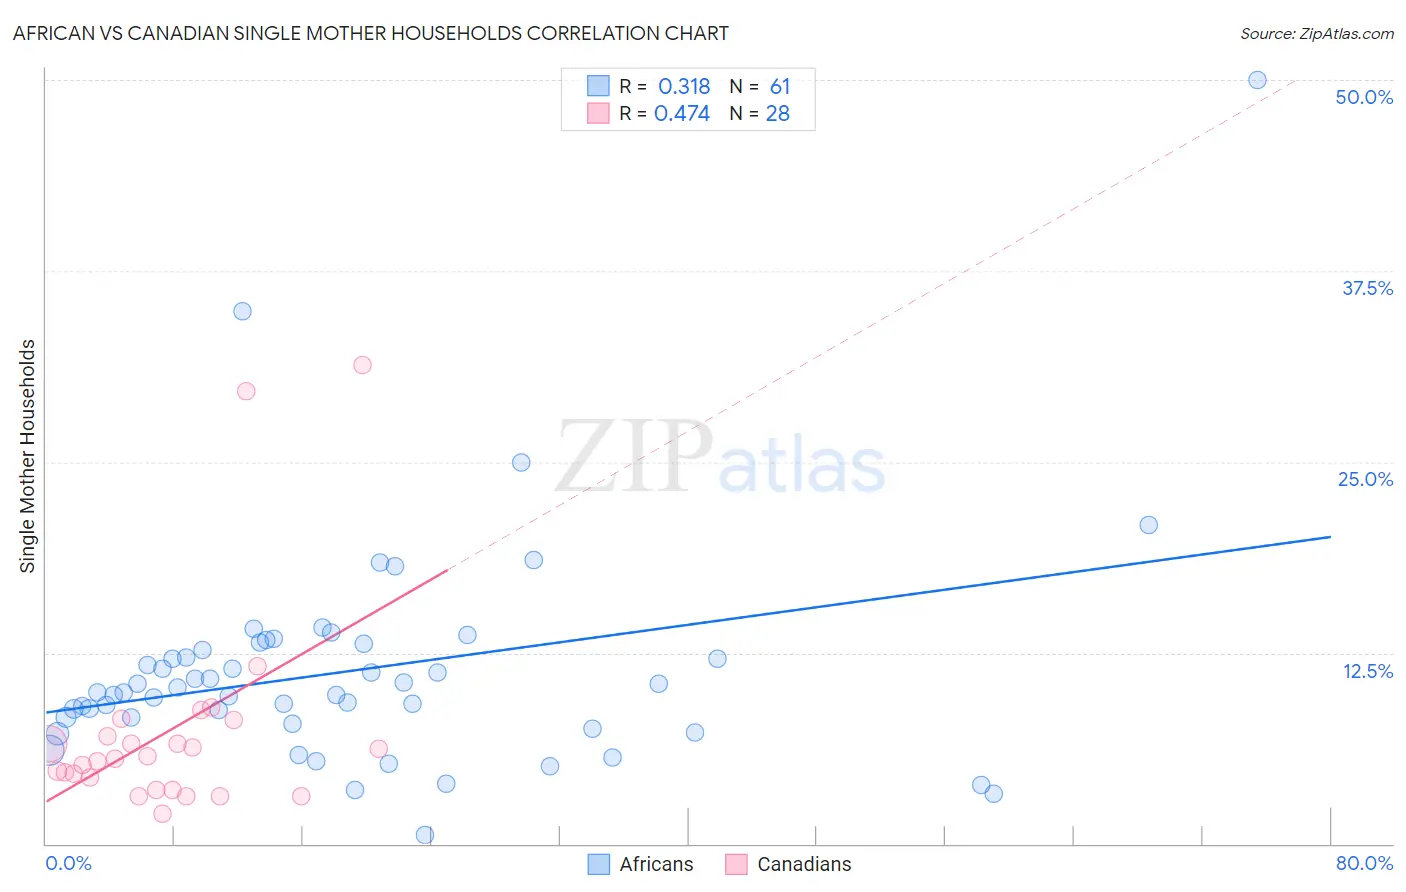
African vs Canadian Single Mother Households Correlation Chart
The statistical analysis conducted on geographies consisting of 468,558,446 people shows a mild positive correlation between the proportion of Africans and percentage of single mother households in the United States with a correlation coefficient (R) of 0.318 and weighted average of 8.2%. Similarly, the statistical analysis conducted on geographies consisting of 435,747,557 people shows a moderate positive correlation between the proportion of Canadians and percentage of single mother households in the United States with a correlation coefficient (R) of 0.474 and weighted average of 5.9%, a difference of 38.1%.
Single Mother Households Correlation Summary
| Measurement | African | Canadian |
| Minimum | 0.60% | 1.9% |
| Maximum | 50.0% | 31.3% |
| Range | 49.4% | 29.4% |
| Mean | 11.3% | 7.4% |
| Median | 9.9% | 5.7% |
| Interquartile 25% (IQ1) | 8.1% | 3.9% |
| Interquartile 75% (IQ3) | 12.9% | 7.6% |
| Interquartile Range (IQR) | 4.8% | 3.6% |
| Standard Deviation (Sample) | 7.3% | 6.9% |
| Standard Deviation (Population) | 7.3% | 6.7% |
Similar Demographics by Single Mother Households
Demographics Similar to Africans by Single Mother Households
In terms of single mother households, the demographic groups most similar to Africans are Immigrants from Honduras (8.2%, a difference of 0.14%), Immigrants from Western Africa (8.2%, a difference of 0.15%), Immigrants from Mexico (8.2%, a difference of 0.17%), Immigrants from Grenada (8.2%, a difference of 0.29%), and Bangladeshi (8.1%, a difference of 0.46%).
| Demographics | Rating | Rank | Single Mother Households |
| Cheyenne | 0.0 /100 | #309 | Tragic 8.1% |
| Hondurans | 0.0 /100 | #310 | Tragic 8.1% |
| Immigrants | Congo | 0.0 /100 | #311 | Tragic 8.1% |
| Bangladeshis | 0.0 /100 | #312 | Tragic 8.1% |
| Immigrants | Grenada | 0.0 /100 | #313 | Tragic 8.2% |
| Immigrants | Mexico | 0.0 /100 | #314 | Tragic 8.2% |
| Immigrants | Western Africa | 0.0 /100 | #315 | Tragic 8.2% |
| Africans | 0.0 /100 | #316 | Tragic 8.2% |
| Immigrants | Honduras | 0.0 /100 | #317 | Tragic 8.2% |
| Senegalese | 0.0 /100 | #318 | Tragic 8.2% |
| Jamaicans | 0.0 /100 | #319 | Tragic 8.2% |
| Bahamians | 0.0 /100 | #320 | Tragic 8.3% |
| Immigrants | Senegal | 0.0 /100 | #321 | Tragic 8.3% |
| Pima | 0.0 /100 | #322 | Tragic 8.3% |
| Haitians | 0.0 /100 | #323 | Tragic 8.3% |
Demographics Similar to Canadians by Single Mother Households
In terms of single mother households, the demographic groups most similar to Canadians are Egyptian (5.9%, a difference of 0.060%), Immigrants from Saudi Arabia (5.9%, a difference of 0.090%), Albanian (5.9%, a difference of 0.22%), Immigrants from Spain (5.9%, a difference of 0.26%), and Jordanian (6.0%, a difference of 0.51%).
| Demographics | Rating | Rank | Single Mother Households |
| Lebanese | 92.4 /100 | #127 | Exceptional 5.9% |
| Czechoslovakians | 92.2 /100 | #128 | Exceptional 5.9% |
| Immigrants | Bolivia | 92.2 /100 | #129 | Exceptional 5.9% |
| Palestinians | 92.1 /100 | #130 | Exceptional 5.9% |
| Immigrants | Spain | 91.2 /100 | #131 | Exceptional 5.9% |
| Albanians | 91.1 /100 | #132 | Exceptional 5.9% |
| Egyptians | 90.7 /100 | #133 | Exceptional 5.9% |
| Canadians | 90.5 /100 | #134 | Exceptional 5.9% |
| Immigrants | Saudi Arabia | 90.2 /100 | #135 | Exceptional 5.9% |
| Jordanians | 88.9 /100 | #136 | Excellent 6.0% |
| Immigrants | Pakistan | 88.4 /100 | #137 | Excellent 6.0% |
| Icelanders | 86.9 /100 | #138 | Excellent 6.0% |
| Syrians | 86.0 /100 | #139 | Excellent 6.0% |
| French | 85.7 /100 | #140 | Excellent 6.0% |
| Tsimshian | 85.2 /100 | #141 | Excellent 6.0% |