Immigrants from Chile vs Canadian Single Mother Households
COMPARE
Immigrants from Chile
Canadian
Single Mother Households
Single Mother Households Comparison
Immigrants from Chile
Canadians
6.3%
SINGLE MOTHER HOUSEHOLDS
58.3/ 100
METRIC RATING
168th/ 347
METRIC RANK
5.9%
SINGLE MOTHER HOUSEHOLDS
90.5/ 100
METRIC RATING
134th/ 347
METRIC RANK
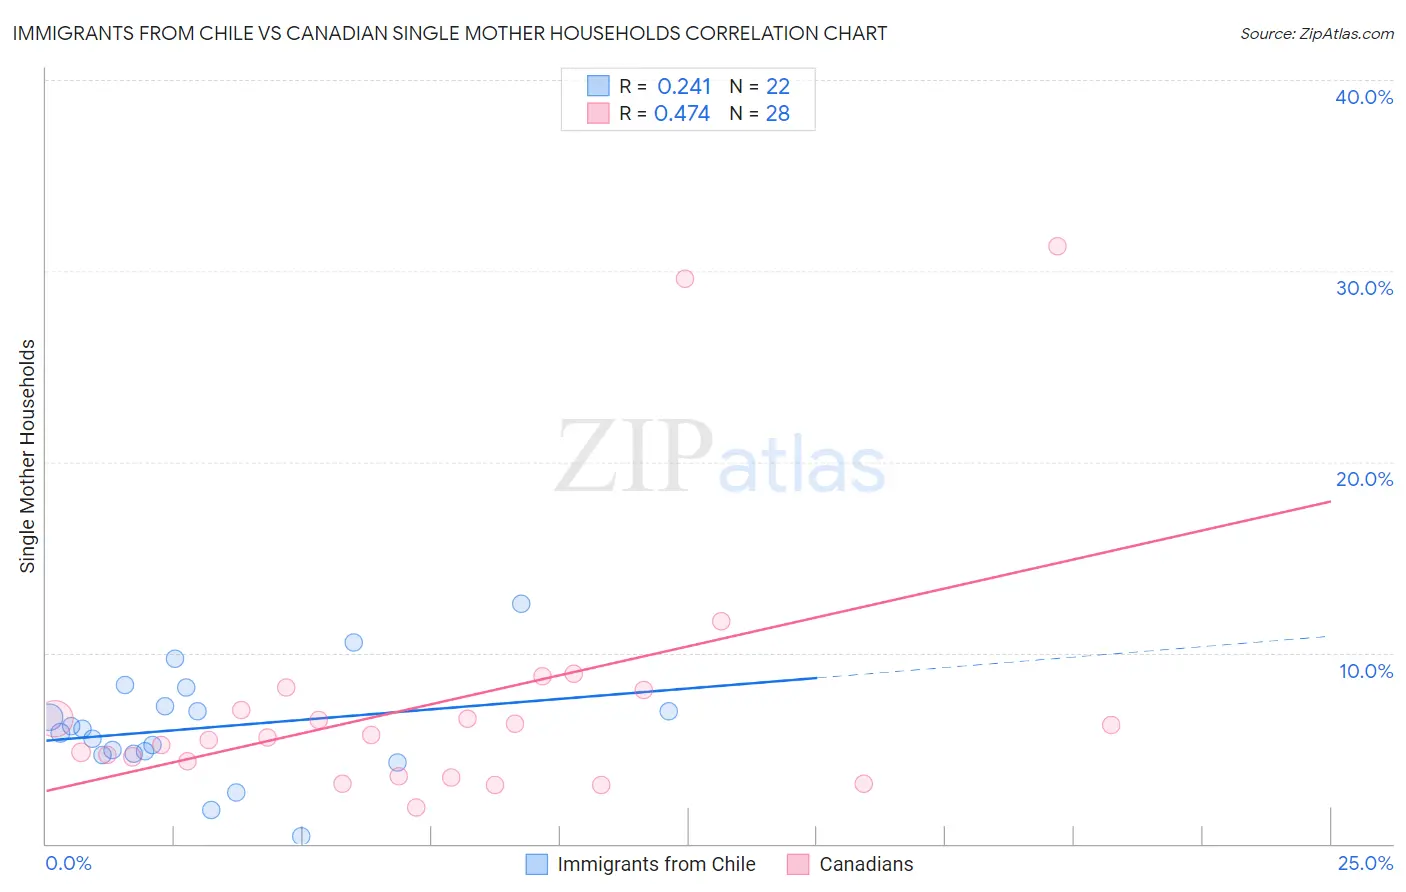
Immigrants from Chile vs Canadian Single Mother Households Correlation Chart
The statistical analysis conducted on geographies consisting of 218,462,093 people shows a weak positive correlation between the proportion of Immigrants from Chile and percentage of single mother households in the United States with a correlation coefficient (R) of 0.241 and weighted average of 6.3%. Similarly, the statistical analysis conducted on geographies consisting of 435,747,557 people shows a moderate positive correlation between the proportion of Canadians and percentage of single mother households in the United States with a correlation coefficient (R) of 0.474 and weighted average of 5.9%, a difference of 5.6%.
Single Mother Households Correlation Summary
| Measurement | Immigrants from Chile | Canadian |
| Minimum | 0.42% | 1.9% |
| Maximum | 12.6% | 31.3% |
| Range | 12.2% | 29.4% |
| Mean | 6.1% | 7.4% |
| Median | 5.9% | 5.7% |
| Interquartile 25% (IQ1) | 4.7% | 3.9% |
| Interquartile 75% (IQ3) | 7.2% | 7.6% |
| Interquartile Range (IQR) | 2.5% | 3.6% |
| Standard Deviation (Sample) | 2.8% | 6.9% |
| Standard Deviation (Population) | 2.7% | 6.7% |
Similar Demographics by Single Mother Households
Demographics Similar to Immigrants from Chile by Single Mother Households
In terms of single mother households, the demographic groups most similar to Immigrants from Chile are Puget Sound Salish (6.3%, a difference of 0.020%), Brazilian (6.2%, a difference of 0.090%), Immigrants from Oceania (6.3%, a difference of 0.42%), Sri Lankan (6.2%, a difference of 0.65%), and Afghan (6.3%, a difference of 0.65%).
| Demographics | Rating | Rank | Single Mother Households |
| Immigrants | Germany | 72.4 /100 | #161 | Good 6.1% |
| Immigrants | Zimbabwe | 69.9 /100 | #162 | Good 6.2% |
| Alsatians | 68.7 /100 | #163 | Good 6.2% |
| Immigrants | Northern Africa | 68.0 /100 | #164 | Good 6.2% |
| Immigrants | Syria | 67.4 /100 | #165 | Good 6.2% |
| Sri Lankans | 63.9 /100 | #166 | Good 6.2% |
| Brazilians | 59.1 /100 | #167 | Average 6.2% |
| Immigrants | Chile | 58.3 /100 | #168 | Average 6.3% |
| Puget Sound Salish | 58.1 /100 | #169 | Average 6.3% |
| Immigrants | Oceania | 54.6 /100 | #170 | Average 6.3% |
| Afghans | 52.5 /100 | #171 | Average 6.3% |
| Immigrants | South Eastern Asia | 52.2 /100 | #172 | Average 6.3% |
| Immigrants | Vietnam | 51.5 /100 | #173 | Average 6.3% |
| Immigrants | Morocco | 50.0 /100 | #174 | Average 6.3% |
| Marshallese | 45.8 /100 | #175 | Average 6.3% |
Demographics Similar to Canadians by Single Mother Households
In terms of single mother households, the demographic groups most similar to Canadians are Egyptian (5.9%, a difference of 0.060%), Immigrants from Saudi Arabia (5.9%, a difference of 0.090%), Albanian (5.9%, a difference of 0.22%), Immigrants from Spain (5.9%, a difference of 0.26%), and Jordanian (6.0%, a difference of 0.51%).
| Demographics | Rating | Rank | Single Mother Households |
| Lebanese | 92.4 /100 | #127 | Exceptional 5.9% |
| Czechoslovakians | 92.2 /100 | #128 | Exceptional 5.9% |
| Immigrants | Bolivia | 92.2 /100 | #129 | Exceptional 5.9% |
| Palestinians | 92.1 /100 | #130 | Exceptional 5.9% |
| Immigrants | Spain | 91.2 /100 | #131 | Exceptional 5.9% |
| Albanians | 91.1 /100 | #132 | Exceptional 5.9% |
| Egyptians | 90.7 /100 | #133 | Exceptional 5.9% |
| Canadians | 90.5 /100 | #134 | Exceptional 5.9% |
| Immigrants | Saudi Arabia | 90.2 /100 | #135 | Exceptional 5.9% |
| Jordanians | 88.9 /100 | #136 | Excellent 6.0% |
| Immigrants | Pakistan | 88.4 /100 | #137 | Excellent 6.0% |
| Icelanders | 86.9 /100 | #138 | Excellent 6.0% |
| Syrians | 86.0 /100 | #139 | Excellent 6.0% |
| French | 85.7 /100 | #140 | Excellent 6.0% |
| Tsimshian | 85.2 /100 | #141 | Excellent 6.0% |