Aleut vs Immigrants from Romania Divorced or Separated
COMPARE
Aleut
Immigrants from Romania
Divorced or Separated
Divorced or Separated Comparison
Aleuts
Immigrants from Romania
12.5%
DIVORCED OR SEPARATED
1.3/ 100
METRIC RATING
251st/ 347
METRIC RANK
11.5%
DIVORCED OR SEPARATED
99.3/ 100
METRIC RATING
82nd/ 347
METRIC RANK
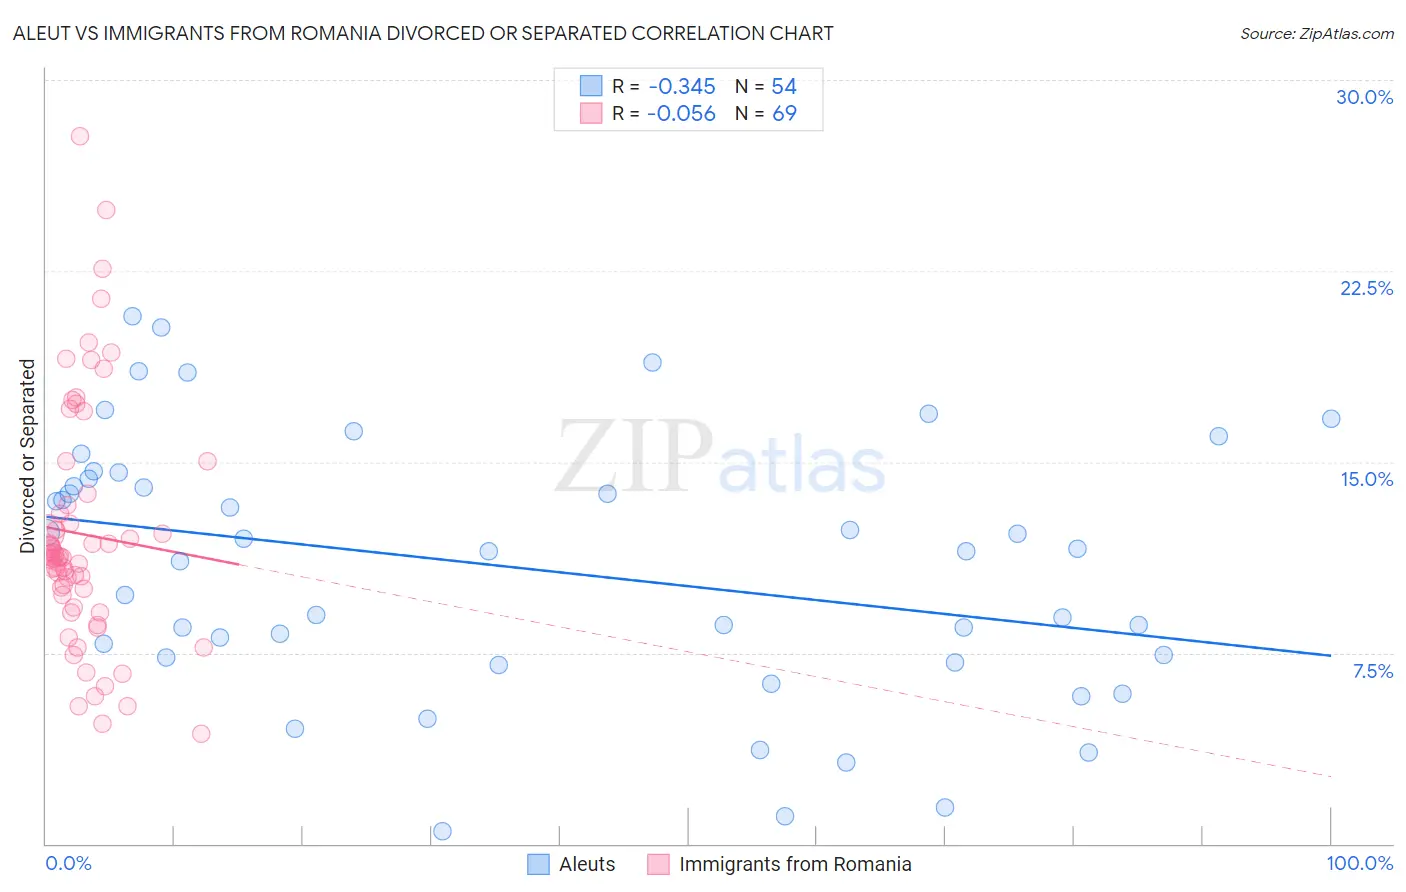
Aleut vs Immigrants from Romania Divorced or Separated Correlation Chart
The statistical analysis conducted on geographies consisting of 61,777,142 people shows a mild negative correlation between the proportion of Aleuts and percentage of population currently divorced or separated in the United States with a correlation coefficient (R) of -0.345 and weighted average of 12.5%. Similarly, the statistical analysis conducted on geographies consisting of 256,993,939 people shows a slight negative correlation between the proportion of Immigrants from Romania and percentage of population currently divorced or separated in the United States with a correlation coefficient (R) of -0.056 and weighted average of 11.5%, a difference of 8.5%.
Divorced or Separated Correlation Summary
| Measurement | Aleut | Immigrants from Romania |
| Minimum | 0.50% | 4.3% |
| Maximum | 20.7% | 27.8% |
| Range | 20.2% | 23.5% |
| Mean | 10.8% | 12.2% |
| Median | 11.5% | 11.3% |
| Interquartile 25% (IQ1) | 7.3% | 9.5% |
| Interquartile 75% (IQ3) | 14.3% | 13.5% |
| Interquartile Range (IQR) | 7.0% | 4.0% |
| Standard Deviation (Sample) | 5.1% | 4.7% |
| Standard Deviation (Population) | 5.0% | 4.7% |
Similar Demographics by Divorced or Separated
Demographics Similar to Aleuts by Divorced or Separated
In terms of divorced or separated, the demographic groups most similar to Aleuts are Irish (12.5%, a difference of 0.0%), Finnish (12.5%, a difference of 0.28%), Nepalese (12.5%, a difference of 0.29%), German (12.5%, a difference of 0.31%), and Liberian (12.6%, a difference of 0.33%).
| Demographics | Rating | Rank | Divorced or Separated |
| Alaska Natives | 2.5 /100 | #244 | Tragic 12.4% |
| Hispanics or Latinos | 2.0 /100 | #245 | Tragic 12.5% |
| Immigrants | West Indies | 1.9 /100 | #246 | Tragic 12.5% |
| Germans | 1.8 /100 | #247 | Tragic 12.5% |
| Nepalese | 1.8 /100 | #248 | Tragic 12.5% |
| Finns | 1.8 /100 | #249 | Tragic 12.5% |
| Irish | 1.3 /100 | #250 | Tragic 12.5% |
| Aleuts | 1.3 /100 | #251 | Tragic 12.5% |
| Liberians | 0.9 /100 | #252 | Tragic 12.6% |
| Somalis | 0.9 /100 | #253 | Tragic 12.6% |
| Senegalese | 0.8 /100 | #254 | Tragic 12.6% |
| Welsh | 0.7 /100 | #255 | Tragic 12.6% |
| Immigrants | Colombia | 0.6 /100 | #256 | Tragic 12.6% |
| Immigrants | Somalia | 0.6 /100 | #257 | Tragic 12.6% |
| Indonesians | 0.6 /100 | #258 | Tragic 12.6% |
Demographics Similar to Immigrants from Romania by Divorced or Separated
In terms of divorced or separated, the demographic groups most similar to Immigrants from Romania are Immigrants from Bulgaria (11.5%, a difference of 0.030%), Bulgarian (11.5%, a difference of 0.050%), Russian (11.5%, a difference of 0.080%), Immigrants from Switzerland (11.5%, a difference of 0.090%), and Guyanese (11.5%, a difference of 0.11%).
| Demographics | Rating | Rank | Divorced or Separated |
| Immigrants | Northern Africa | 99.6 /100 | #75 | Exceptional 11.5% |
| Albanians | 99.6 /100 | #76 | Exceptional 11.5% |
| Immigrants | Italy | 99.5 /100 | #77 | Exceptional 11.5% |
| Afghans | 99.4 /100 | #78 | Exceptional 11.5% |
| Guyanese | 99.4 /100 | #79 | Exceptional 11.5% |
| Immigrants | Switzerland | 99.4 /100 | #80 | Exceptional 11.5% |
| Russians | 99.4 /100 | #81 | Exceptional 11.5% |
| Immigrants | Romania | 99.3 /100 | #82 | Exceptional 11.5% |
| Immigrants | Bulgaria | 99.3 /100 | #83 | Exceptional 11.5% |
| Bulgarians | 99.3 /100 | #84 | Exceptional 11.5% |
| Immigrants | Albania | 99.3 /100 | #85 | Exceptional 11.5% |
| Immigrants | Latvia | 99.2 /100 | #86 | Exceptional 11.6% |
| Immigrants | Nepal | 99.2 /100 | #87 | Exceptional 11.6% |
| Immigrants | Europe | 99.2 /100 | #88 | Exceptional 11.6% |
| Immigrants | Southern Europe | 99.1 /100 | #89 | Exceptional 11.6% |