Spanish American vs Immigrants from Romania Divorced or Separated
COMPARE
Spanish American
Immigrants from Romania
Divorced or Separated
Divorced or Separated Comparison
Spanish Americans
Immigrants from Romania
13.3%
DIVORCED OR SEPARATED
0.0/ 100
METRIC RATING
315th/ 347
METRIC RANK
11.5%
DIVORCED OR SEPARATED
99.3/ 100
METRIC RATING
82nd/ 347
METRIC RANK
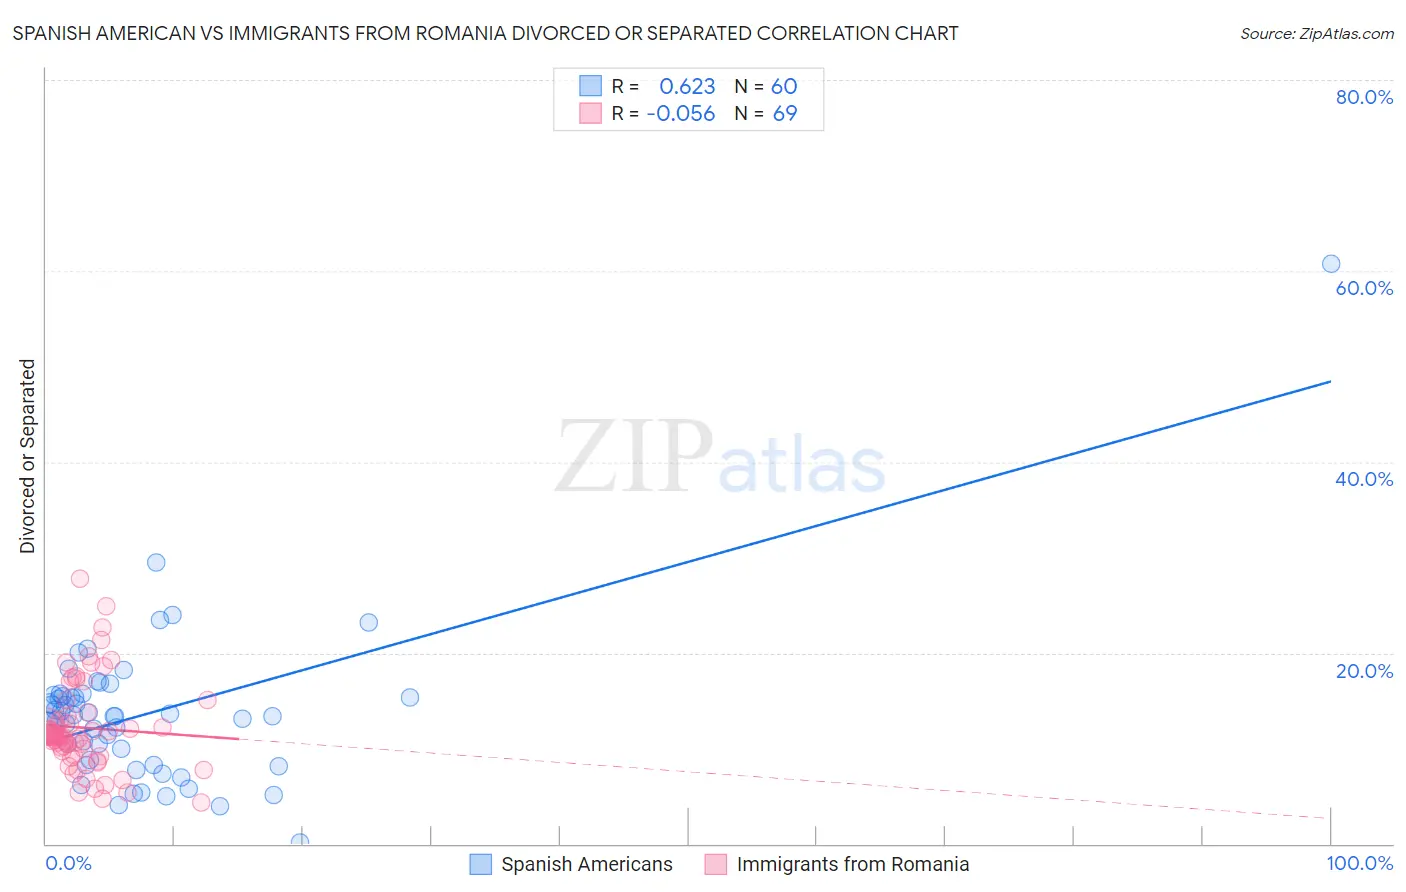
Spanish American vs Immigrants from Romania Divorced or Separated Correlation Chart
The statistical analysis conducted on geographies consisting of 103,168,591 people shows a significant positive correlation between the proportion of Spanish Americans and percentage of population currently divorced or separated in the United States with a correlation coefficient (R) of 0.623 and weighted average of 13.3%. Similarly, the statistical analysis conducted on geographies consisting of 256,993,939 people shows a slight negative correlation between the proportion of Immigrants from Romania and percentage of population currently divorced or separated in the United States with a correlation coefficient (R) of -0.056 and weighted average of 11.5%, a difference of 15.7%.
Divorced or Separated Correlation Summary
| Measurement | Spanish American | Immigrants from Romania |
| Minimum | 0.10% | 4.3% |
| Maximum | 60.7% | 27.8% |
| Range | 60.6% | 23.5% |
| Mean | 13.6% | 12.2% |
| Median | 13.4% | 11.3% |
| Interquartile 25% (IQ1) | 8.5% | 9.5% |
| Interquartile 75% (IQ3) | 15.6% | 13.5% |
| Interquartile Range (IQR) | 7.0% | 4.0% |
| Standard Deviation (Sample) | 8.2% | 4.7% |
| Standard Deviation (Population) | 8.2% | 4.7% |
Similar Demographics by Divorced or Separated
Demographics Similar to Spanish Americans by Divorced or Separated
In terms of divorced or separated, the demographic groups most similar to Spanish Americans are Tsimshian (13.3%, a difference of 0.030%), Haitian (13.3%, a difference of 0.050%), Cree (13.4%, a difference of 0.080%), Puget Sound Salish (13.4%, a difference of 0.12%), and Cajun (13.4%, a difference of 0.18%).
| Demographics | Rating | Rank | Divorced or Separated |
| Ottawa | 0.0 /100 | #308 | Tragic 13.2% |
| Americans | 0.0 /100 | #309 | Tragic 13.2% |
| Africans | 0.0 /100 | #310 | Tragic 13.2% |
| Sioux | 0.0 /100 | #311 | Tragic 13.2% |
| Blackfeet | 0.0 /100 | #312 | Tragic 13.3% |
| Immigrants | Nicaragua | 0.0 /100 | #313 | Tragic 13.3% |
| Yaqui | 0.0 /100 | #314 | Tragic 13.3% |
| Spanish Americans | 0.0 /100 | #315 | Tragic 13.3% |
| Tsimshian | 0.0 /100 | #316 | Tragic 13.3% |
| Haitians | 0.0 /100 | #317 | Tragic 13.3% |
| Cree | 0.0 /100 | #318 | Tragic 13.4% |
| Puget Sound Salish | 0.0 /100 | #319 | Tragic 13.4% |
| Cajuns | 0.0 /100 | #320 | Tragic 13.4% |
| Cheyenne | 0.0 /100 | #321 | Tragic 13.4% |
| Immigrants | Haiti | 0.0 /100 | #322 | Tragic 13.4% |
Demographics Similar to Immigrants from Romania by Divorced or Separated
In terms of divorced or separated, the demographic groups most similar to Immigrants from Romania are Immigrants from Bulgaria (11.5%, a difference of 0.030%), Bulgarian (11.5%, a difference of 0.050%), Russian (11.5%, a difference of 0.080%), Immigrants from Switzerland (11.5%, a difference of 0.090%), and Guyanese (11.5%, a difference of 0.11%).
| Demographics | Rating | Rank | Divorced or Separated |
| Immigrants | Northern Africa | 99.6 /100 | #75 | Exceptional 11.5% |
| Albanians | 99.6 /100 | #76 | Exceptional 11.5% |
| Immigrants | Italy | 99.5 /100 | #77 | Exceptional 11.5% |
| Afghans | 99.4 /100 | #78 | Exceptional 11.5% |
| Guyanese | 99.4 /100 | #79 | Exceptional 11.5% |
| Immigrants | Switzerland | 99.4 /100 | #80 | Exceptional 11.5% |
| Russians | 99.4 /100 | #81 | Exceptional 11.5% |
| Immigrants | Romania | 99.3 /100 | #82 | Exceptional 11.5% |
| Immigrants | Bulgaria | 99.3 /100 | #83 | Exceptional 11.5% |
| Bulgarians | 99.3 /100 | #84 | Exceptional 11.5% |
| Immigrants | Albania | 99.3 /100 | #85 | Exceptional 11.5% |
| Immigrants | Latvia | 99.2 /100 | #86 | Exceptional 11.6% |
| Immigrants | Nepal | 99.2 /100 | #87 | Exceptional 11.6% |
| Immigrants | Europe | 99.2 /100 | #88 | Exceptional 11.6% |
| Immigrants | Southern Europe | 99.1 /100 | #89 | Exceptional 11.6% |