Irish vs Immigrants from Korea Family Households
COMPARE
Irish
Immigrants from Korea
Family Households
Family Households Comparison
Irish
Immigrants from Korea
64.4%
FAMILY HOUSEHOLDS
57.9/ 100
METRIC RATING
167th/ 347
METRIC RANK
66.0%
FAMILY HOUSEHOLDS
100.0/ 100
METRIC RATING
59th/ 347
METRIC RANK
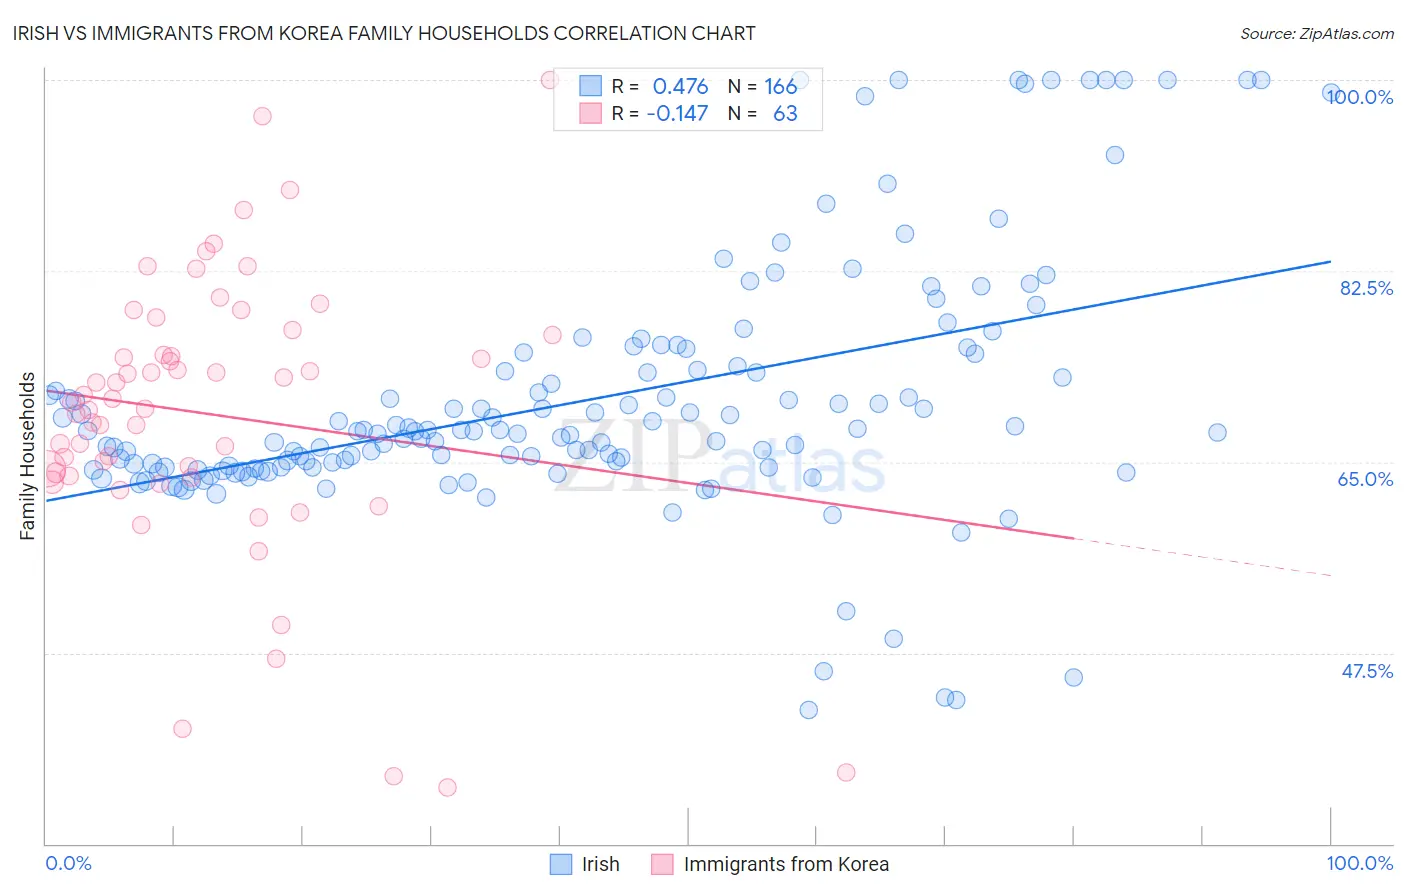
Irish vs Immigrants from Korea Family Households Correlation Chart
The statistical analysis conducted on geographies consisting of 580,015,491 people shows a moderate positive correlation between the proportion of Irish and percentage of family households in the United States with a correlation coefficient (R) of 0.476 and weighted average of 64.4%. Similarly, the statistical analysis conducted on geographies consisting of 415,966,940 people shows a poor negative correlation between the proportion of Immigrants from Korea and percentage of family households in the United States with a correlation coefficient (R) of -0.147 and weighted average of 66.0%, a difference of 2.6%.
Family Households Correlation Summary
| Measurement | Irish | Immigrants from Korea |
| Minimum | 42.2% | 35.2% |
| Maximum | 100.0% | 100.0% |
| Range | 57.8% | 64.8% |
| Mean | 70.7% | 69.4% |
| Median | 67.8% | 70.4% |
| Interquartile 25% (IQ1) | 64.5% | 63.7% |
| Interquartile 75% (IQ3) | 73.8% | 76.6% |
| Interquartile Range (IQR) | 9.3% | 12.9% |
| Standard Deviation (Sample) | 11.6% | 12.8% |
| Standard Deviation (Population) | 11.5% | 12.7% |
Similar Demographics by Family Households
Demographics Similar to Irish by Family Households
In terms of family households, the demographic groups most similar to Irish are Honduran (64.4%, a difference of 0.010%), Scotch-Irish (64.4%, a difference of 0.020%), Immigrants from Nigeria (64.4%, a difference of 0.030%), Immigrants from Southern Europe (64.4%, a difference of 0.030%), and Iraqi (64.4%, a difference of 0.030%).
| Demographics | Rating | Rank | Family Households |
| Immigrants | Moldova | 65.2 /100 | #160 | Good 64.4% |
| Immigrants | England | 62.6 /100 | #161 | Good 64.4% |
| British | 61.6 /100 | #162 | Good 64.4% |
| Chickasaw | 61.5 /100 | #163 | Good 64.4% |
| Immigrants | Nigeria | 60.1 /100 | #164 | Good 64.4% |
| Immigrants | Southern Europe | 60.0 /100 | #165 | Good 64.4% |
| Scotch-Irish | 59.2 /100 | #166 | Average 64.4% |
| Irish | 57.9 /100 | #167 | Average 64.4% |
| Hondurans | 57.5 /100 | #168 | Average 64.4% |
| Iraqis | 56.0 /100 | #169 | Average 64.4% |
| Armenians | 55.9 /100 | #170 | Average 64.4% |
| Ute | 54.6 /100 | #171 | Average 64.3% |
| Dutch West Indians | 53.9 /100 | #172 | Average 64.3% |
| Immigrants | Sierra Leone | 52.5 /100 | #173 | Average 64.3% |
| Immigrants | Germany | 50.0 /100 | #174 | Average 64.3% |
Demographics Similar to Immigrants from Korea by Family Households
In terms of family households, the demographic groups most similar to Immigrants from Korea are South American (66.0%, a difference of 0.010%), Immigrants from Asia (66.1%, a difference of 0.020%), Danish (66.0%, a difference of 0.030%), Central American (66.0%, a difference of 0.060%), and Immigrants from Indonesia (66.0%, a difference of 0.10%).
| Demographics | Rating | Rank | Family Households |
| Colombians | 100.0 /100 | #52 | Exceptional 66.3% |
| Afghans | 100.0 /100 | #53 | Exceptional 66.3% |
| Immigrants | Colombia | 100.0 /100 | #54 | Exceptional 66.3% |
| Immigrants | Immigrants | 100.0 /100 | #55 | Exceptional 66.1% |
| Immigrants | Hong Kong | 100.0 /100 | #56 | Exceptional 66.1% |
| Pennsylvania Germans | 100.0 /100 | #57 | Exceptional 66.1% |
| Immigrants | Asia | 100.0 /100 | #58 | Exceptional 66.1% |
| Immigrants | Korea | 100.0 /100 | #59 | Exceptional 66.0% |
| South Americans | 100.0 /100 | #60 | Exceptional 66.0% |
| Danes | 100.0 /100 | #61 | Exceptional 66.0% |
| Central Americans | 100.0 /100 | #62 | Exceptional 66.0% |
| Immigrants | Indonesia | 100.0 /100 | #63 | Exceptional 66.0% |
| Pima | 99.9 /100 | #64 | Exceptional 65.9% |
| Costa Ricans | 99.9 /100 | #65 | Exceptional 65.9% |
| Fijians | 99.9 /100 | #66 | Exceptional 65.9% |