Irish vs Immigrants from Jordan Family Households
COMPARE
Irish
Immigrants from Jordan
Family Households
Family Households Comparison
Irish
Immigrants from Jordan
64.4%
FAMILY HOUSEHOLDS
57.9/ 100
METRIC RATING
167th/ 347
METRIC RANK
65.0%
FAMILY HOUSEHOLDS
96.5/ 100
METRIC RATING
112th/ 347
METRIC RANK
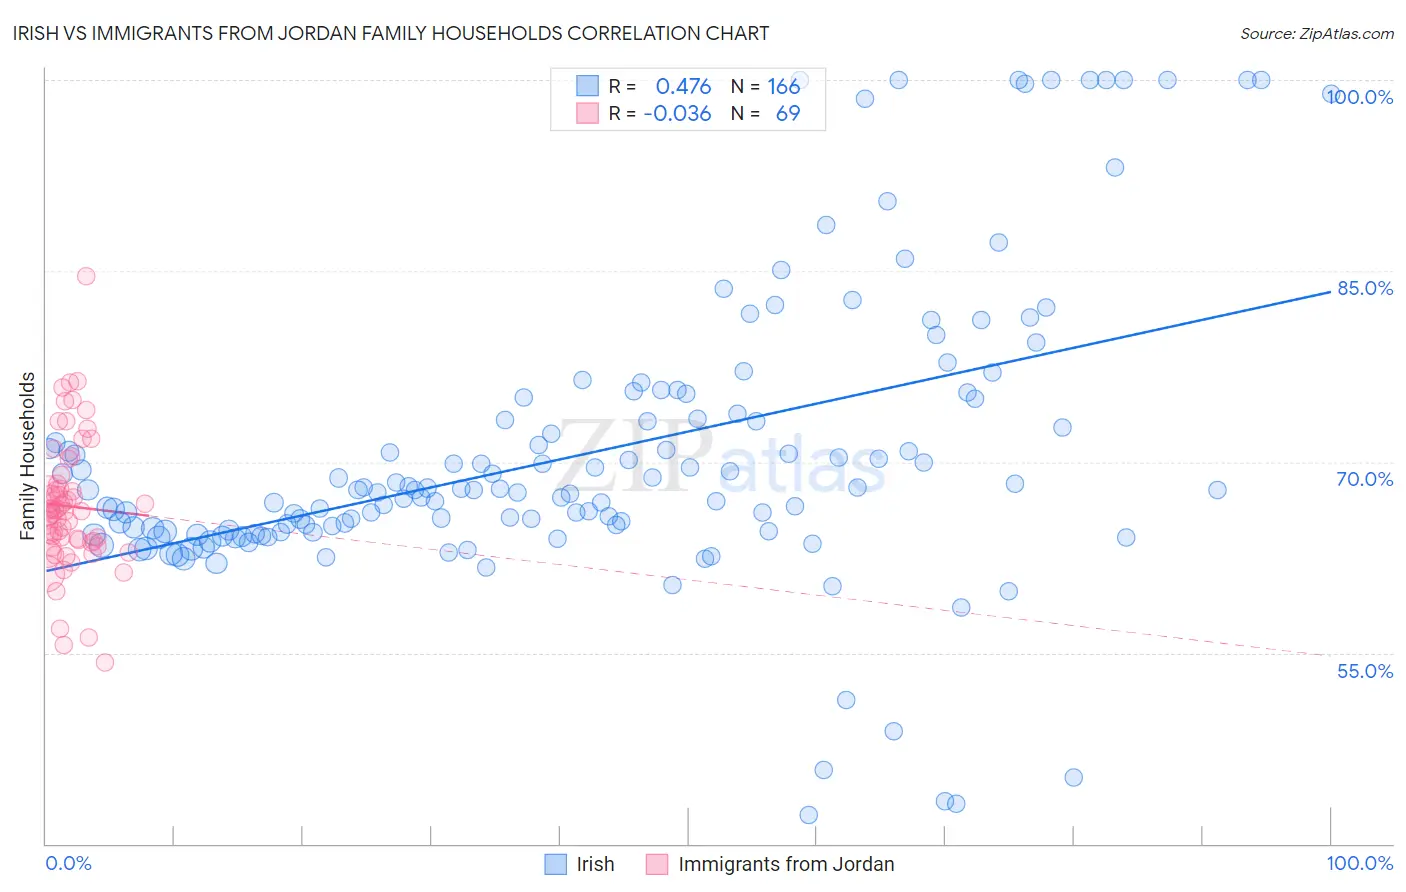
Irish vs Immigrants from Jordan Family Households Correlation Chart
The statistical analysis conducted on geographies consisting of 580,015,491 people shows a moderate positive correlation between the proportion of Irish and percentage of family households in the United States with a correlation coefficient (R) of 0.476 and weighted average of 64.4%. Similarly, the statistical analysis conducted on geographies consisting of 181,252,628 people shows no correlation between the proportion of Immigrants from Jordan and percentage of family households in the United States with a correlation coefficient (R) of -0.036 and weighted average of 65.0%, a difference of 1.0%.
Family Households Correlation Summary
| Measurement | Irish | Immigrants from Jordan |
| Minimum | 42.2% | 54.2% |
| Maximum | 100.0% | 84.6% |
| Range | 57.8% | 30.4% |
| Mean | 70.7% | 66.5% |
| Median | 67.8% | 66.1% |
| Interquartile 25% (IQ1) | 64.5% | 63.7% |
| Interquartile 75% (IQ3) | 73.8% | 68.3% |
| Interquartile Range (IQR) | 9.3% | 4.6% |
| Standard Deviation (Sample) | 11.6% | 5.2% |
| Standard Deviation (Population) | 11.5% | 5.1% |
Similar Demographics by Family Households
Demographics Similar to Irish by Family Households
In terms of family households, the demographic groups most similar to Irish are Honduran (64.4%, a difference of 0.010%), Scotch-Irish (64.4%, a difference of 0.020%), Immigrants from Nigeria (64.4%, a difference of 0.030%), Immigrants from Southern Europe (64.4%, a difference of 0.030%), and Iraqi (64.4%, a difference of 0.030%).
| Demographics | Rating | Rank | Family Households |
| Immigrants | Moldova | 65.2 /100 | #160 | Good 64.4% |
| Immigrants | England | 62.6 /100 | #161 | Good 64.4% |
| British | 61.6 /100 | #162 | Good 64.4% |
| Chickasaw | 61.5 /100 | #163 | Good 64.4% |
| Immigrants | Nigeria | 60.1 /100 | #164 | Good 64.4% |
| Immigrants | Southern Europe | 60.0 /100 | #165 | Good 64.4% |
| Scotch-Irish | 59.2 /100 | #166 | Average 64.4% |
| Irish | 57.9 /100 | #167 | Average 64.4% |
| Hondurans | 57.5 /100 | #168 | Average 64.4% |
| Iraqis | 56.0 /100 | #169 | Average 64.4% |
| Armenians | 55.9 /100 | #170 | Average 64.4% |
| Ute | 54.6 /100 | #171 | Average 64.3% |
| Dutch West Indians | 53.9 /100 | #172 | Average 64.3% |
| Immigrants | Sierra Leone | 52.5 /100 | #173 | Average 64.3% |
| Immigrants | Germany | 50.0 /100 | #174 | Average 64.3% |
Demographics Similar to Immigrants from Jordan by Family Households
In terms of family households, the demographic groups most similar to Immigrants from Jordan are European (65.0%, a difference of 0.030%), Spanish (65.0%, a difference of 0.030%), Scandinavian (65.0%, a difference of 0.040%), Immigrants from Guatemala (65.0%, a difference of 0.050%), and Argentinean (65.0%, a difference of 0.060%).
| Demographics | Rating | Rank | Family Households |
| English | 97.4 /100 | #105 | Exceptional 65.1% |
| Whites/Caucasians | 97.3 /100 | #106 | Exceptional 65.1% |
| Alaska Natives | 97.3 /100 | #107 | Exceptional 65.1% |
| Palestinians | 97.2 /100 | #108 | Exceptional 65.1% |
| Immigrants | Guatemala | 96.9 /100 | #109 | Exceptional 65.0% |
| Scandinavians | 96.8 /100 | #110 | Exceptional 65.0% |
| Europeans | 96.8 /100 | #111 | Exceptional 65.0% |
| Immigrants | Jordan | 96.5 /100 | #112 | Exceptional 65.0% |
| Spanish | 96.2 /100 | #113 | Exceptional 65.0% |
| Argentineans | 95.7 /100 | #114 | Exceptional 65.0% |
| Ecuadorians | 95.4 /100 | #115 | Exceptional 65.0% |
| Immigrants | Iraq | 95.4 /100 | #116 | Exceptional 65.0% |
| Cherokee | 95.3 /100 | #117 | Exceptional 65.0% |
| Dutch | 95.1 /100 | #118 | Exceptional 64.9% |
| Immigrants | Eastern Asia | 94.4 /100 | #119 | Exceptional 64.9% |