Irish vs Nonimmigrants Family Households
COMPARE
Irish
Nonimmigrants
Family Households
Family Households Comparison
Irish
Nonimmigrants
64.4%
FAMILY HOUSEHOLDS
57.9/ 100
METRIC RATING
167th/ 347
METRIC RANK
64.8%
FAMILY HOUSEHOLDS
90.1/ 100
METRIC RATING
131st/ 347
METRIC RANK
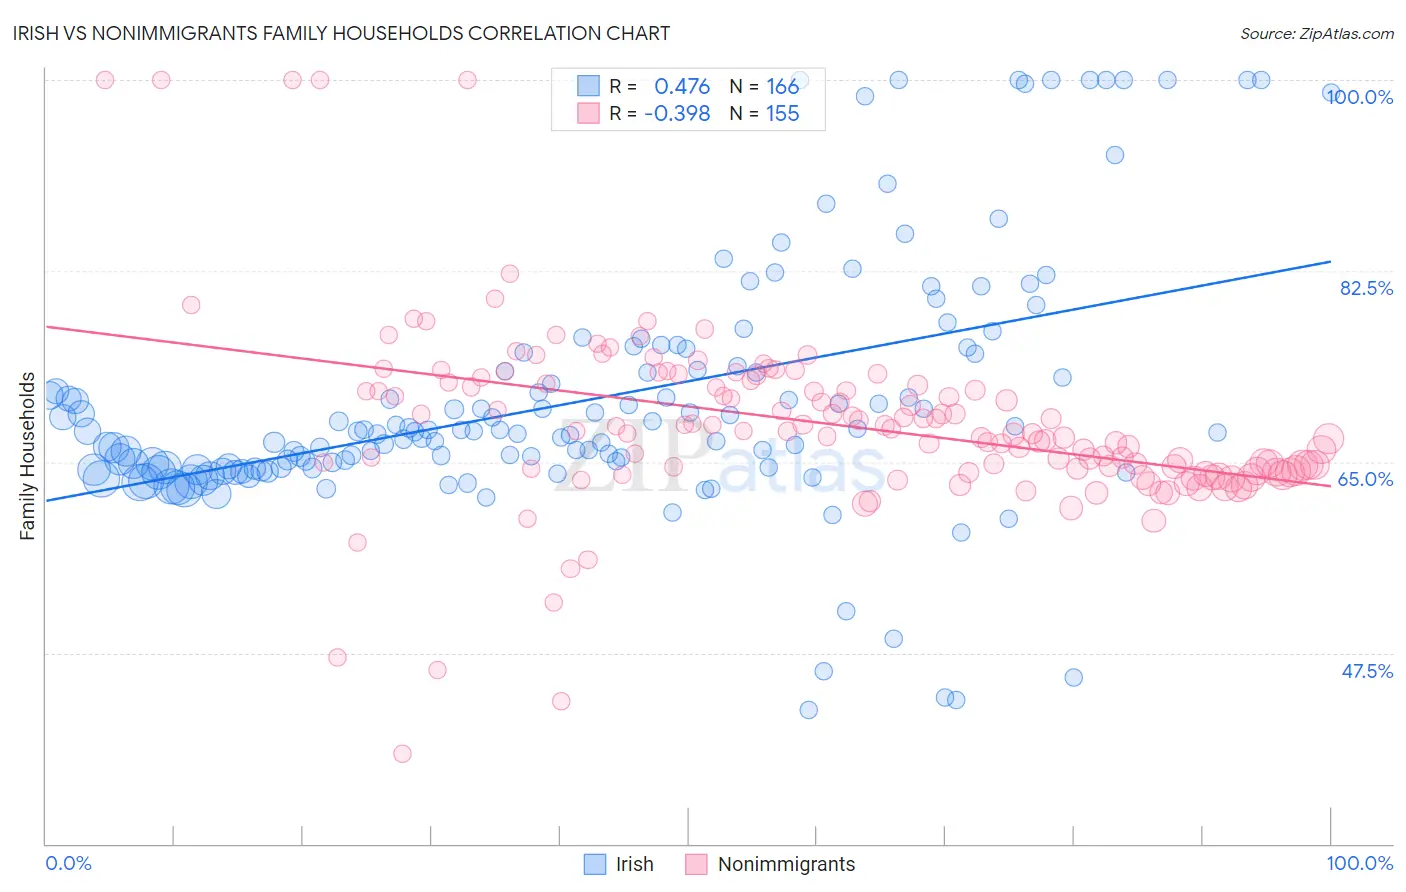
Irish vs Nonimmigrants Family Households Correlation Chart
The statistical analysis conducted on geographies consisting of 580,015,491 people shows a moderate positive correlation between the proportion of Irish and percentage of family households in the United States with a correlation coefficient (R) of 0.476 and weighted average of 64.4%. Similarly, the statistical analysis conducted on geographies consisting of 584,651,779 people shows a mild negative correlation between the proportion of Nonimmigrants and percentage of family households in the United States with a correlation coefficient (R) of -0.398 and weighted average of 64.8%, a difference of 0.63%.
Family Households Correlation Summary
| Measurement | Irish | Nonimmigrants |
| Minimum | 42.2% | 38.2% |
| Maximum | 100.0% | 100.0% |
| Range | 57.8% | 61.8% |
| Mean | 70.7% | 68.5% |
| Median | 67.8% | 67.8% |
| Interquartile 25% (IQ1) | 64.5% | 64.2% |
| Interquartile 75% (IQ3) | 73.8% | 72.3% |
| Interquartile Range (IQR) | 9.3% | 8.1% |
| Standard Deviation (Sample) | 11.6% | 8.6% |
| Standard Deviation (Population) | 11.5% | 8.6% |
Similar Demographics by Family Households
Demographics Similar to Irish by Family Households
In terms of family households, the demographic groups most similar to Irish are Honduran (64.4%, a difference of 0.010%), Scotch-Irish (64.4%, a difference of 0.020%), Immigrants from Nigeria (64.4%, a difference of 0.030%), Immigrants from Southern Europe (64.4%, a difference of 0.030%), and Iraqi (64.4%, a difference of 0.030%).
| Demographics | Rating | Rank | Family Households |
| Immigrants | Moldova | 65.2 /100 | #160 | Good 64.4% |
| Immigrants | England | 62.6 /100 | #161 | Good 64.4% |
| British | 61.6 /100 | #162 | Good 64.4% |
| Chickasaw | 61.5 /100 | #163 | Good 64.4% |
| Immigrants | Nigeria | 60.1 /100 | #164 | Good 64.4% |
| Immigrants | Southern Europe | 60.0 /100 | #165 | Good 64.4% |
| Scotch-Irish | 59.2 /100 | #166 | Average 64.4% |
| Irish | 57.9 /100 | #167 | Average 64.4% |
| Hondurans | 57.5 /100 | #168 | Average 64.4% |
| Iraqis | 56.0 /100 | #169 | Average 64.4% |
| Armenians | 55.9 /100 | #170 | Average 64.4% |
| Ute | 54.6 /100 | #171 | Average 64.3% |
| Dutch West Indians | 53.9 /100 | #172 | Average 64.3% |
| Immigrants | Sierra Leone | 52.5 /100 | #173 | Average 64.3% |
| Immigrants | Germany | 50.0 /100 | #174 | Average 64.3% |
Demographics Similar to Nonimmigrants by Family Households
In terms of family households, the demographic groups most similar to Nonimmigrants are Immigrants from Italy (64.8%, a difference of 0.010%), Cajun (64.8%, a difference of 0.020%), Belizean (64.8%, a difference of 0.030%), Immigrants from Ecuador (64.8%, a difference of 0.050%), and Italian (64.8%, a difference of 0.070%).
| Demographics | Rating | Rank | Family Households |
| Immigrants | Argentina | 92.8 /100 | #124 | Exceptional 64.9% |
| Immigrants | Belize | 92.7 /100 | #125 | Exceptional 64.9% |
| Panamanians | 92.4 /100 | #126 | Exceptional 64.8% |
| Immigrants | Panama | 92.0 /100 | #127 | Exceptional 64.8% |
| Italians | 91.9 /100 | #128 | Exceptional 64.8% |
| Immigrants | Ecuador | 91.4 /100 | #129 | Exceptional 64.8% |
| Immigrants | Italy | 90.2 /100 | #130 | Exceptional 64.8% |
| Immigrants | Nonimmigrants | 90.1 /100 | #131 | Exceptional 64.8% |
| Cajuns | 89.4 /100 | #132 | Excellent 64.8% |
| Belizeans | 89.3 /100 | #133 | Excellent 64.8% |
| Greeks | 88.1 /100 | #134 | Excellent 64.7% |
| Maltese | 87.4 /100 | #135 | Excellent 64.7% |
| Immigrants | China | 86.6 /100 | #136 | Excellent 64.7% |
| Immigrants | Scotland | 86.4 /100 | #137 | Excellent 64.7% |
| Basques | 85.5 /100 | #138 | Excellent 64.7% |