Iraqi vs Spanish American Married-couple Households
COMPARE
Iraqi
Spanish American
Married-couple Households
Married-couple Households Comparison
Iraqis
Spanish Americans
46.9%
MARRIED-COUPLE HOUSEHOLDS
71.7/ 100
METRIC RATING
160th/ 347
METRIC RANK
44.5%
MARRIED-COUPLE HOUSEHOLDS
1.1/ 100
METRIC RATING
239th/ 347
METRIC RANK
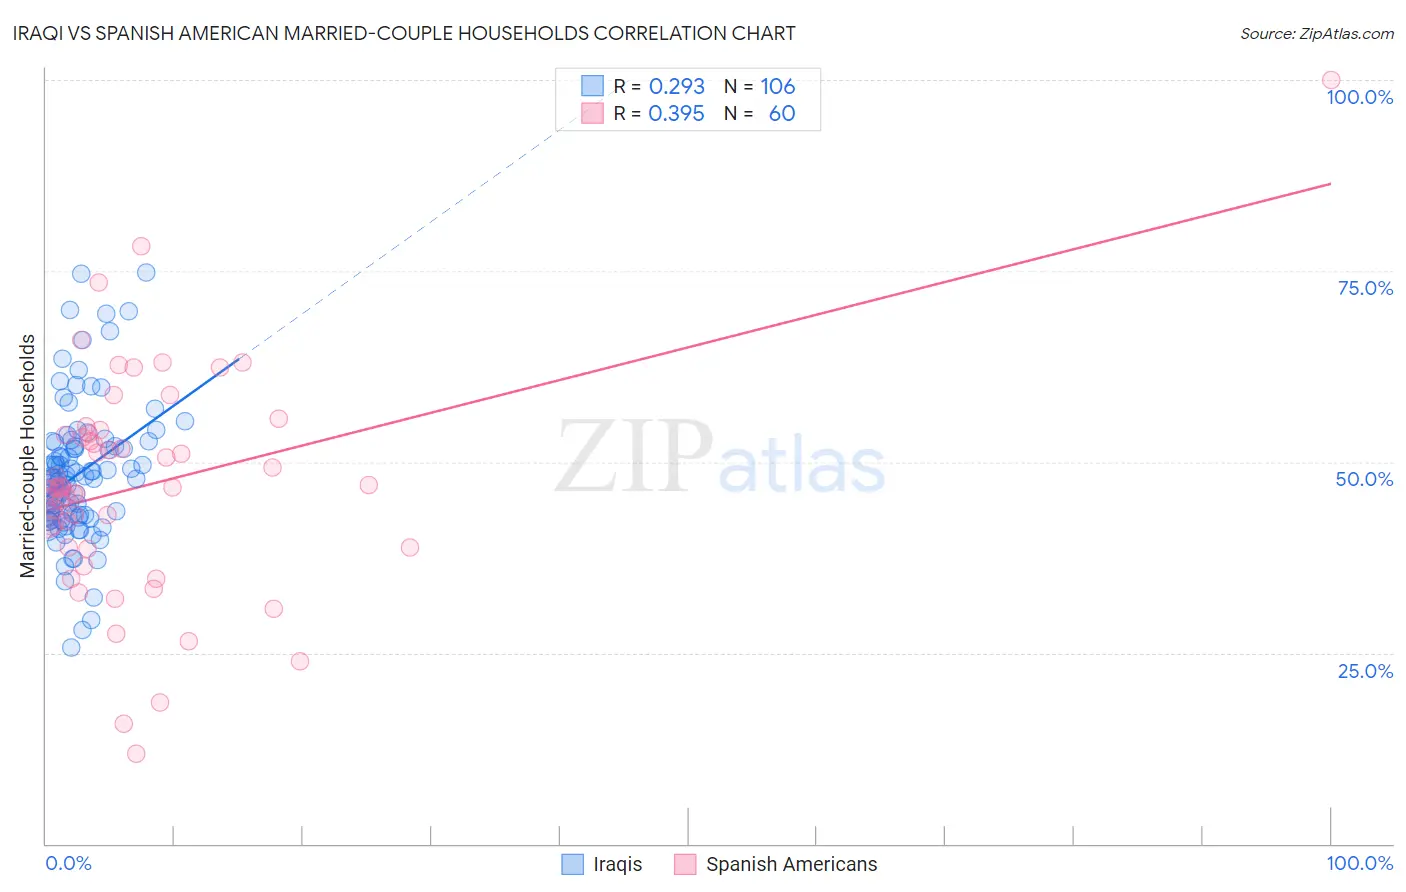
Iraqi vs Spanish American Married-couple Households Correlation Chart
The statistical analysis conducted on geographies consisting of 170,633,006 people shows a weak positive correlation between the proportion of Iraqis and percentage of married-couple family households in the United States with a correlation coefficient (R) of 0.293 and weighted average of 46.9%. Similarly, the statistical analysis conducted on geographies consisting of 103,168,336 people shows a mild positive correlation between the proportion of Spanish Americans and percentage of married-couple family households in the United States with a correlation coefficient (R) of 0.395 and weighted average of 44.5%, a difference of 5.3%.
Married-couple Households Correlation Summary
| Measurement | Iraqi | Spanish American |
| Minimum | 25.7% | 11.8% |
| Maximum | 74.8% | 100.0% |
| Range | 49.1% | 88.2% |
| Mean | 48.4% | 46.9% |
| Median | 47.9% | 46.6% |
| Interquartile 25% (IQ1) | 43.0% | 38.8% |
| Interquartile 75% (IQ3) | 52.0% | 53.6% |
| Interquartile Range (IQR) | 9.1% | 14.9% |
| Standard Deviation (Sample) | 9.0% | 14.7% |
| Standard Deviation (Population) | 8.9% | 14.6% |
Similar Demographics by Married-couple Households
Demographics Similar to Iraqis by Married-couple Households
In terms of married-couple households, the demographic groups most similar to Iraqis are Delaware (46.8%, a difference of 0.020%), Colombian (46.8%, a difference of 0.030%), Nonimmigrants (46.9%, a difference of 0.070%), Osage (46.9%, a difference of 0.070%), and Immigrants from Turkey (46.8%, a difference of 0.070%).
| Demographics | Rating | Rank | Married-couple Households |
| Hmong | 76.2 /100 | #153 | Good 47.0% |
| Immigrants | Western Asia | 76.1 /100 | #154 | Good 46.9% |
| Arabs | 76.0 /100 | #155 | Good 46.9% |
| Armenians | 75.4 /100 | #156 | Good 46.9% |
| Immigrants | Oceania | 74.8 /100 | #157 | Good 46.9% |
| Immigrants | Nonimmigrants | 73.3 /100 | #158 | Good 46.9% |
| Osage | 73.2 /100 | #159 | Good 46.9% |
| Iraqis | 71.7 /100 | #160 | Good 46.9% |
| Delaware | 71.2 /100 | #161 | Good 46.8% |
| Colombians | 71.0 /100 | #162 | Good 46.8% |
| Immigrants | Turkey | 70.2 /100 | #163 | Good 46.8% |
| Immigrants | Kazakhstan | 70.0 /100 | #164 | Good 46.8% |
| Immigrants | Southern Europe | 69.9 /100 | #165 | Good 46.8% |
| Cherokee | 65.7 /100 | #166 | Good 46.7% |
| Immigrants | Croatia | 64.2 /100 | #167 | Good 46.7% |
Demographics Similar to Spanish Americans by Married-couple Households
In terms of married-couple households, the demographic groups most similar to Spanish Americans are Immigrants from Uruguay (44.5%, a difference of 0.020%), Comanche (44.5%, a difference of 0.070%), Ute (44.4%, a difference of 0.080%), Immigrants from Bosnia and Herzegovina (44.4%, a difference of 0.080%), and Immigrants from Nicaragua (44.5%, a difference of 0.10%).
| Demographics | Rating | Rank | Married-couple Households |
| Marshallese | 1.5 /100 | #232 | Tragic 44.6% |
| Immigrants | Uganda | 1.5 /100 | #233 | Tragic 44.6% |
| Immigrants | Panama | 1.3 /100 | #234 | Tragic 44.6% |
| Immigrants | Nicaragua | 1.2 /100 | #235 | Tragic 44.5% |
| Yaqui | 1.2 /100 | #236 | Tragic 44.5% |
| Comanche | 1.2 /100 | #237 | Tragic 44.5% |
| Immigrants | Uruguay | 1.1 /100 | #238 | Tragic 44.5% |
| Spanish Americans | 1.1 /100 | #239 | Tragic 44.5% |
| Ute | 1.0 /100 | #240 | Tragic 44.4% |
| Immigrants | Bosnia and Herzegovina | 1.0 /100 | #241 | Tragic 44.4% |
| Immigrants | Albania | 1.0 /100 | #242 | Tragic 44.4% |
| Immigrants | Saudi Arabia | 0.9 /100 | #243 | Tragic 44.4% |
| Immigrants | Armenia | 0.7 /100 | #244 | Tragic 44.3% |
| Immigrants | El Salvador | 0.7 /100 | #245 | Tragic 44.3% |
| Immigrants | Cuba | 0.6 /100 | #246 | Tragic 44.2% |