Iraqi vs Moroccan Married-couple Households
COMPARE
Iraqi
Moroccan
Married-couple Households
Married-couple Households Comparison
Iraqis
Moroccans
46.9%
MARRIED-COUPLE HOUSEHOLDS
71.7/ 100
METRIC RATING
160th/ 347
METRIC RANK
43.5%
MARRIED-COUPLE HOUSEHOLDS
0.1/ 100
METRIC RATING
265th/ 347
METRIC RANK
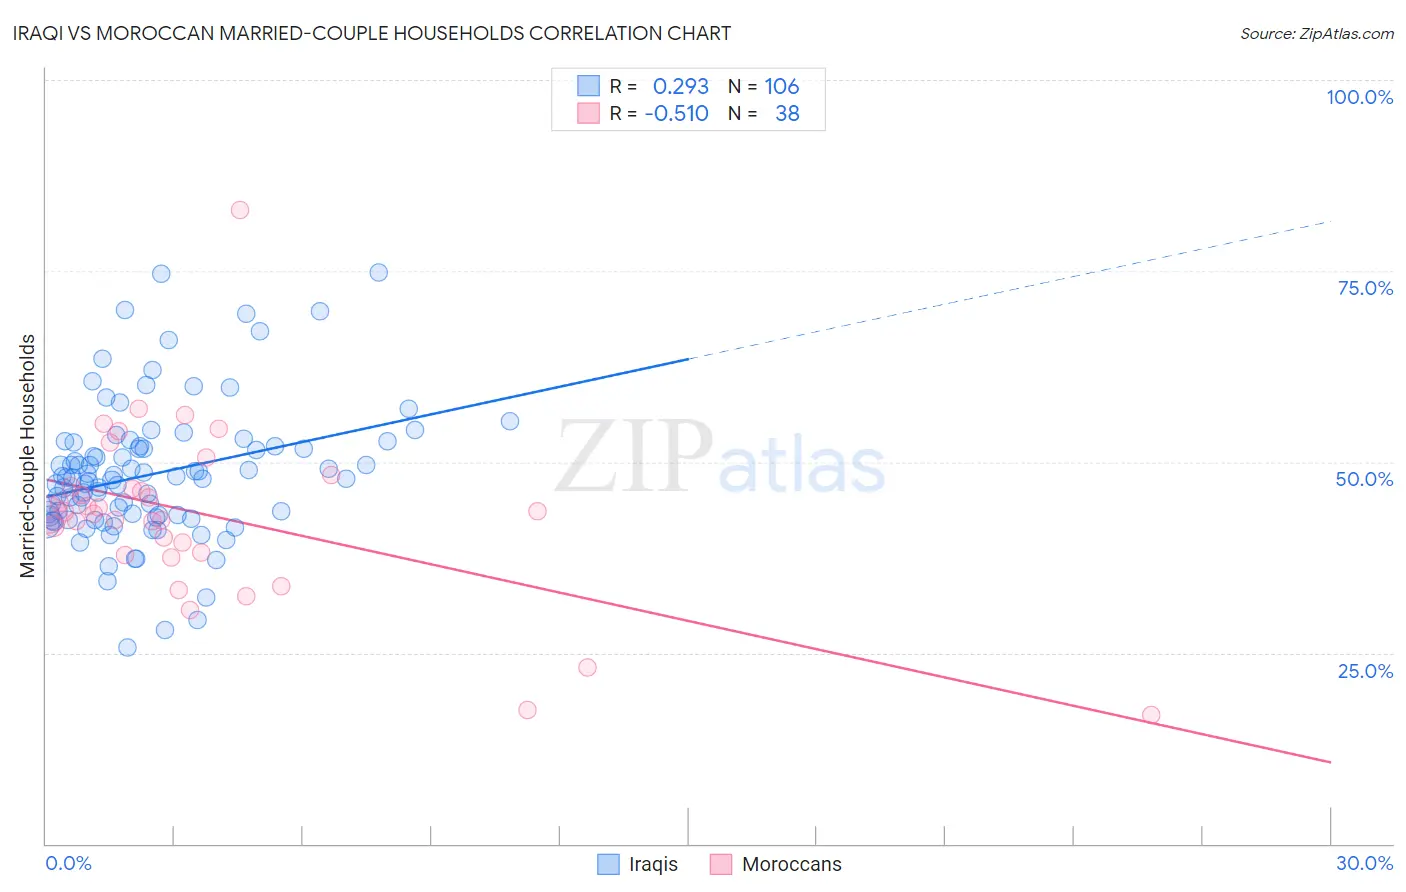
Iraqi vs Moroccan Married-couple Households Correlation Chart
The statistical analysis conducted on geographies consisting of 170,633,006 people shows a weak positive correlation between the proportion of Iraqis and percentage of married-couple family households in the United States with a correlation coefficient (R) of 0.293 and weighted average of 46.9%. Similarly, the statistical analysis conducted on geographies consisting of 201,755,880 people shows a substantial negative correlation between the proportion of Moroccans and percentage of married-couple family households in the United States with a correlation coefficient (R) of -0.510 and weighted average of 43.5%, a difference of 7.7%.
Married-couple Households Correlation Summary
| Measurement | Iraqi | Moroccan |
| Minimum | 25.7% | 16.8% |
| Maximum | 74.8% | 83.0% |
| Range | 49.1% | 66.2% |
| Mean | 48.4% | 43.1% |
| Median | 47.9% | 43.3% |
| Interquartile 25% (IQ1) | 43.0% | 38.2% |
| Interquartile 75% (IQ3) | 52.0% | 46.7% |
| Interquartile Range (IQR) | 9.1% | 8.5% |
| Standard Deviation (Sample) | 9.0% | 11.5% |
| Standard Deviation (Population) | 8.9% | 11.3% |
Similar Demographics by Married-couple Households
Demographics Similar to Iraqis by Married-couple Households
In terms of married-couple households, the demographic groups most similar to Iraqis are Delaware (46.8%, a difference of 0.020%), Colombian (46.8%, a difference of 0.030%), Nonimmigrants (46.9%, a difference of 0.070%), Osage (46.9%, a difference of 0.070%), and Immigrants from Turkey (46.8%, a difference of 0.070%).
| Demographics | Rating | Rank | Married-couple Households |
| Hmong | 76.2 /100 | #153 | Good 47.0% |
| Immigrants | Western Asia | 76.1 /100 | #154 | Good 46.9% |
| Arabs | 76.0 /100 | #155 | Good 46.9% |
| Armenians | 75.4 /100 | #156 | Good 46.9% |
| Immigrants | Oceania | 74.8 /100 | #157 | Good 46.9% |
| Immigrants | Nonimmigrants | 73.3 /100 | #158 | Good 46.9% |
| Osage | 73.2 /100 | #159 | Good 46.9% |
| Iraqis | 71.7 /100 | #160 | Good 46.9% |
| Delaware | 71.2 /100 | #161 | Good 46.8% |
| Colombians | 71.0 /100 | #162 | Good 46.8% |
| Immigrants | Turkey | 70.2 /100 | #163 | Good 46.8% |
| Immigrants | Kazakhstan | 70.0 /100 | #164 | Good 46.8% |
| Immigrants | Southern Europe | 69.9 /100 | #165 | Good 46.8% |
| Cherokee | 65.7 /100 | #166 | Good 46.7% |
| Immigrants | Croatia | 64.2 /100 | #167 | Good 46.7% |
Demographics Similar to Moroccans by Married-couple Households
In terms of married-couple households, the demographic groups most similar to Moroccans are Ecuadorian (43.5%, a difference of 0.040%), Bangladeshi (43.5%, a difference of 0.080%), Native/Alaskan (43.5%, a difference of 0.090%), Cree (43.6%, a difference of 0.19%), and Immigrants from Burma/Myanmar (43.4%, a difference of 0.20%).
| Demographics | Rating | Rank | Married-couple Households |
| Central American Indians | 0.2 /100 | #258 | Tragic 43.8% |
| Iroquois | 0.2 /100 | #259 | Tragic 43.7% |
| Immigrants | Cameroon | 0.2 /100 | #260 | Tragic 43.7% |
| Alaskan Athabascans | 0.2 /100 | #261 | Tragic 43.6% |
| Vietnamese | 0.2 /100 | #262 | Tragic 43.6% |
| Cree | 0.1 /100 | #263 | Tragic 43.6% |
| Bangladeshis | 0.1 /100 | #264 | Tragic 43.5% |
| Moroccans | 0.1 /100 | #265 | Tragic 43.5% |
| Ecuadorians | 0.1 /100 | #266 | Tragic 43.5% |
| Natives/Alaskans | 0.1 /100 | #267 | Tragic 43.5% |
| Immigrants | Burma/Myanmar | 0.1 /100 | #268 | Tragic 43.4% |
| Immigrants | Sierra Leone | 0.1 /100 | #269 | Tragic 43.3% |
| Yuman | 0.1 /100 | #270 | Tragic 43.3% |
| Guatemalans | 0.1 /100 | #271 | Tragic 43.3% |
| Immigrants | Nigeria | 0.1 /100 | #272 | Tragic 43.2% |