Iranian vs Nepalese Family Households
COMPARE
Iranian
Nepalese
Family Households
Family Households Comparison
Iranians
Nepalese
63.9%
FAMILY HOUSEHOLDS
13.5/ 100
METRIC RATING
202nd/ 347
METRIC RANK
67.2%
FAMILY HOUSEHOLDS
100.0/ 100
METRIC RATING
32nd/ 347
METRIC RANK
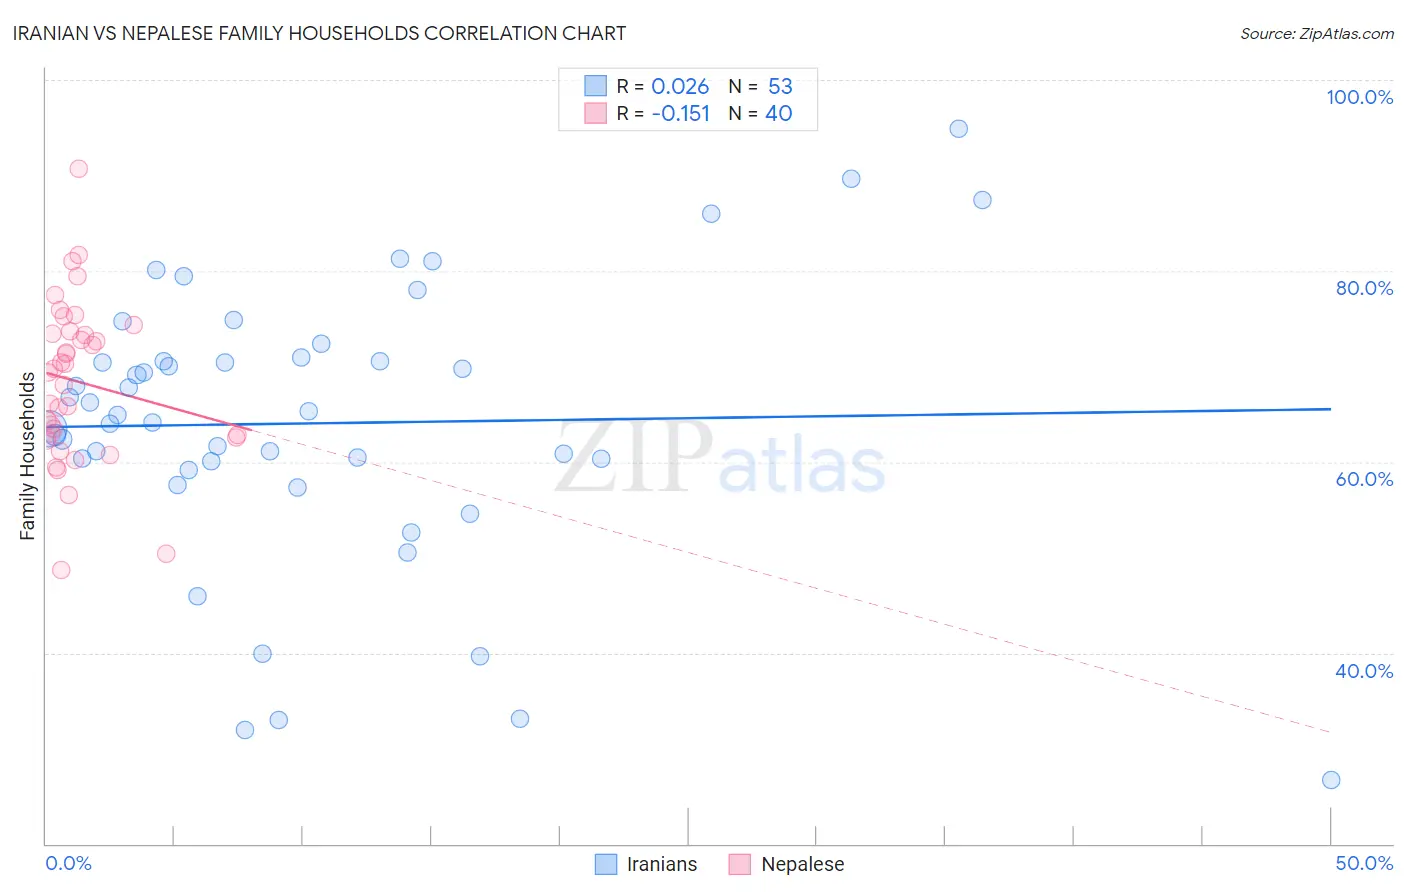
Iranian vs Nepalese Family Households Correlation Chart
The statistical analysis conducted on geographies consisting of 316,654,989 people shows no correlation between the proportion of Iranians and percentage of family households in the United States with a correlation coefficient (R) of 0.026 and weighted average of 63.9%. Similarly, the statistical analysis conducted on geographies consisting of 24,521,755 people shows a poor negative correlation between the proportion of Nepalese and percentage of family households in the United States with a correlation coefficient (R) of -0.151 and weighted average of 67.2%, a difference of 5.2%.
Family Households Correlation Summary
| Measurement | Iranian | Nepalese |
| Minimum | 26.7% | 48.7% |
| Maximum | 94.9% | 90.6% |
| Range | 68.2% | 41.9% |
| Mean | 64.0% | 68.4% |
| Median | 64.9% | 69.5% |
| Interquartile 25% (IQ1) | 59.6% | 62.7% |
| Interquartile 75% (IQ3) | 70.7% | 73.5% |
| Interquartile Range (IQR) | 11.2% | 10.9% |
| Standard Deviation (Sample) | 14.6% | 8.5% |
| Standard Deviation (Population) | 14.4% | 8.4% |
Similar Demographics by Family Households
Demographics Similar to Iranians by Family Households
In terms of family households, the demographic groups most similar to Iranians are Norwegian (63.9%, a difference of 0.010%), Immigrants from Uruguay (63.9%, a difference of 0.020%), Brazilian (63.9%, a difference of 0.030%), Immigrants from Lithuania (63.9%, a difference of 0.040%), and Nigerian (63.9%, a difference of 0.060%).
| Demographics | Rating | Rank | Family Households |
| Immigrants | North America | 20.0 /100 | #195 | Poor 64.0% |
| Immigrants | Canada | 19.2 /100 | #196 | Poor 64.0% |
| Seminole | 18.9 /100 | #197 | Poor 64.0% |
| Poles | 18.9 /100 | #198 | Poor 64.0% |
| Slavs | 18.6 /100 | #199 | Poor 64.0% |
| Immigrants | Malaysia | 17.9 /100 | #200 | Poor 64.0% |
| Immigrants | Eastern Europe | 17.2 /100 | #201 | Poor 64.0% |
| Iranians | 13.5 /100 | #202 | Poor 63.9% |
| Norwegians | 13.2 /100 | #203 | Poor 63.9% |
| Immigrants | Uruguay | 12.8 /100 | #204 | Poor 63.9% |
| Brazilians | 12.4 /100 | #205 | Poor 63.9% |
| Immigrants | Lithuania | 12.1 /100 | #206 | Poor 63.9% |
| Nigerians | 11.5 /100 | #207 | Poor 63.9% |
| Immigrants | Bangladesh | 11.4 /100 | #208 | Poor 63.9% |
| Sierra Leoneans | 11.2 /100 | #209 | Poor 63.9% |
Demographics Similar to Nepalese by Family Households
In terms of family households, the demographic groups most similar to Nepalese are Salvadoran (67.2%, a difference of 0.040%), Thai (67.2%, a difference of 0.040%), Immigrants from Latin America (67.2%, a difference of 0.060%), Immigrants from Peru (67.2%, a difference of 0.070%), and Tohono O'odham (67.1%, a difference of 0.090%).
| Demographics | Rating | Rank | Family Households |
| Immigrants | Nicaragua | 100.0 /100 | #25 | Exceptional 67.5% |
| Immigrants | India | 100.0 /100 | #26 | Exceptional 67.4% |
| Hispanics or Latinos | 100.0 /100 | #27 | Exceptional 67.4% |
| Hawaiians | 100.0 /100 | #28 | Exceptional 67.4% |
| Nicaraguans | 100.0 /100 | #29 | Exceptional 67.4% |
| Immigrants | Peru | 100.0 /100 | #30 | Exceptional 67.2% |
| Immigrants | Latin America | 100.0 /100 | #31 | Exceptional 67.2% |
| Nepalese | 100.0 /100 | #32 | Exceptional 67.2% |
| Salvadorans | 100.0 /100 | #33 | Exceptional 67.2% |
| Thais | 100.0 /100 | #34 | Exceptional 67.2% |
| Tohono O'odham | 100.0 /100 | #35 | Exceptional 67.1% |
| Peruvians | 100.0 /100 | #36 | Exceptional 67.1% |
| Tsimshian | 100.0 /100 | #37 | Exceptional 67.1% |
| Mexican American Indians | 100.0 /100 | #38 | Exceptional 67.0% |
| Immigrants | El Salvador | 100.0 /100 | #39 | Exceptional 67.0% |