Immigrants from Barbados vs Korean Family Households
COMPARE
Immigrants from Barbados
Korean
Family Households
Family Households Comparison
Immigrants from Barbados
Koreans
63.2%
FAMILY HOUSEHOLDS
0.7/ 100
METRIC RATING
258th/ 347
METRIC RANK
68.3%
FAMILY HOUSEHOLDS
100.0/ 100
METRIC RATING
12th/ 347
METRIC RANK
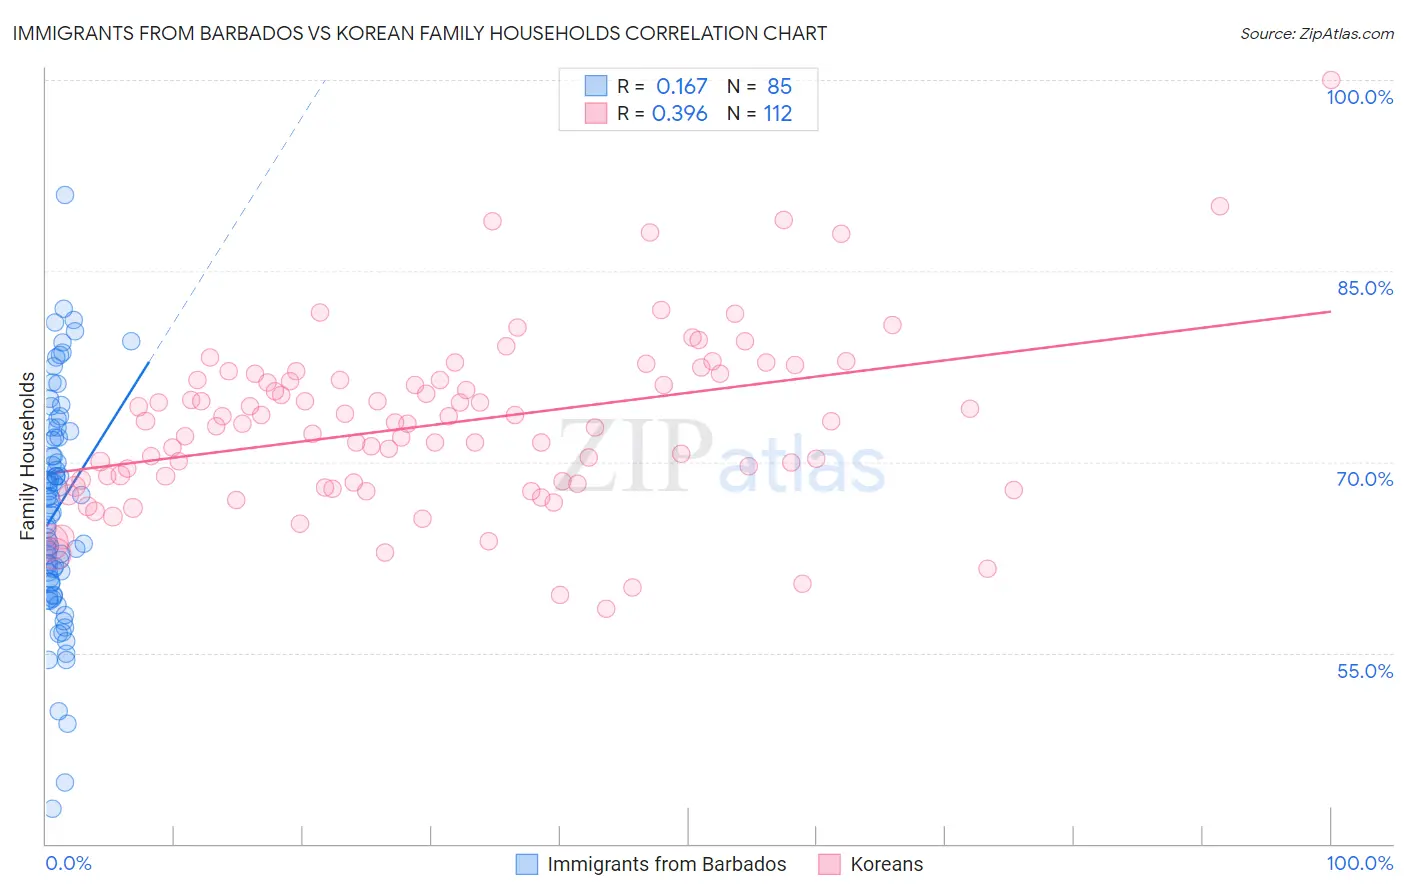
Immigrants from Barbados vs Korean Family Households Correlation Chart
The statistical analysis conducted on geographies consisting of 112,769,646 people shows a poor positive correlation between the proportion of Immigrants from Barbados and percentage of family households in the United States with a correlation coefficient (R) of 0.167 and weighted average of 63.2%. Similarly, the statistical analysis conducted on geographies consisting of 510,403,530 people shows a mild positive correlation between the proportion of Koreans and percentage of family households in the United States with a correlation coefficient (R) of 0.396 and weighted average of 68.3%, a difference of 8.0%.
Family Households Correlation Summary
| Measurement | Immigrants from Barbados | Korean |
| Minimum | 42.7% | 58.5% |
| Maximum | 91.0% | 100.0% |
| Range | 48.2% | 41.5% |
| Mean | 66.3% | 73.0% |
| Median | 66.6% | 73.1% |
| Interquartile 25% (IQ1) | 60.7% | 68.4% |
| Interquartile 75% (IQ3) | 72.2% | 76.5% |
| Interquartile Range (IQR) | 11.5% | 8.1% |
| Standard Deviation (Sample) | 8.7% | 6.7% |
| Standard Deviation (Population) | 8.6% | 6.7% |
Similar Demographics by Family Households
Demographics Similar to Immigrants from Barbados by Family Households
In terms of family households, the demographic groups most similar to Immigrants from Barbados are Immigrants from Western Europe (63.2%, a difference of 0.010%), Cypriot (63.2%, a difference of 0.030%), Immigrants from Russia (63.2%, a difference of 0.050%), Immigrants from Ireland (63.2%, a difference of 0.060%), and Icelander (63.3%, a difference of 0.070%).
| Demographics | Rating | Rank | Family Households |
| Taiwanese | 1.2 /100 | #251 | Tragic 63.3% |
| Bahamians | 1.1 /100 | #252 | Tragic 63.3% |
| Immigrants | Dominican Republic | 1.0 /100 | #253 | Tragic 63.3% |
| Slovaks | 1.0 /100 | #254 | Tragic 63.3% |
| Potawatomi | 1.0 /100 | #255 | Tragic 63.3% |
| Luxembourgers | 0.9 /100 | #256 | Tragic 63.3% |
| Icelanders | 0.8 /100 | #257 | Tragic 63.3% |
| Immigrants | Barbados | 0.7 /100 | #258 | Tragic 63.2% |
| Immigrants | Western Europe | 0.6 /100 | #259 | Tragic 63.2% |
| Cypriots | 0.6 /100 | #260 | Tragic 63.2% |
| Immigrants | Russia | 0.6 /100 | #261 | Tragic 63.2% |
| Immigrants | Ireland | 0.6 /100 | #262 | Tragic 63.2% |
| Cheyenne | 0.5 /100 | #263 | Tragic 63.2% |
| Kenyans | 0.5 /100 | #264 | Tragic 63.2% |
| Colville | 0.5 /100 | #265 | Tragic 63.2% |
Demographics Similar to Koreans by Family Households
In terms of family households, the demographic groups most similar to Koreans are Immigrants from Central America (68.3%, a difference of 0.030%), Pueblo (68.2%, a difference of 0.080%), Immigrants from Cuba (68.2%, a difference of 0.090%), Immigrants from Philippines (68.3%, a difference of 0.10%), and Assyrian/Chaldean/Syriac (68.2%, a difference of 0.15%).
| Demographics | Rating | Rank | Family Households |
| Yuman | 100.0 /100 | #5 | Exceptional 69.3% |
| Immigrants | Mexico | 100.0 /100 | #6 | Exceptional 69.1% |
| Mexicans | 100.0 /100 | #7 | Exceptional 69.0% |
| Immigrants | Fiji | 100.0 /100 | #8 | Exceptional 68.8% |
| Native Hawaiians | 100.0 /100 | #9 | Exceptional 68.4% |
| Immigrants | Philippines | 100.0 /100 | #10 | Exceptional 68.3% |
| Immigrants | Central America | 100.0 /100 | #11 | Exceptional 68.3% |
| Koreans | 100.0 /100 | #12 | Exceptional 68.3% |
| Pueblo | 100.0 /100 | #13 | Exceptional 68.2% |
| Immigrants | Cuba | 100.0 /100 | #14 | Exceptional 68.2% |
| Assyrians/Chaldeans/Syriacs | 100.0 /100 | #15 | Exceptional 68.2% |
| Immigrants | Vietnam | 100.0 /100 | #16 | Exceptional 68.2% |
| Chinese | 100.0 /100 | #17 | Exceptional 68.1% |
| Immigrants | Taiwan | 100.0 /100 | #18 | Exceptional 68.0% |
| Samoans | 100.0 /100 | #19 | Exceptional 67.9% |