Immigrants from Nepal vs Korean Family Households
COMPARE
Immigrants from Nepal
Korean
Family Households
Family Households Comparison
Immigrants from Nepal
Koreans
62.7%
FAMILY HOUSEHOLDS
0.1/ 100
METRIC RATING
289th/ 347
METRIC RANK
68.3%
FAMILY HOUSEHOLDS
100.0/ 100
METRIC RATING
12th/ 347
METRIC RANK
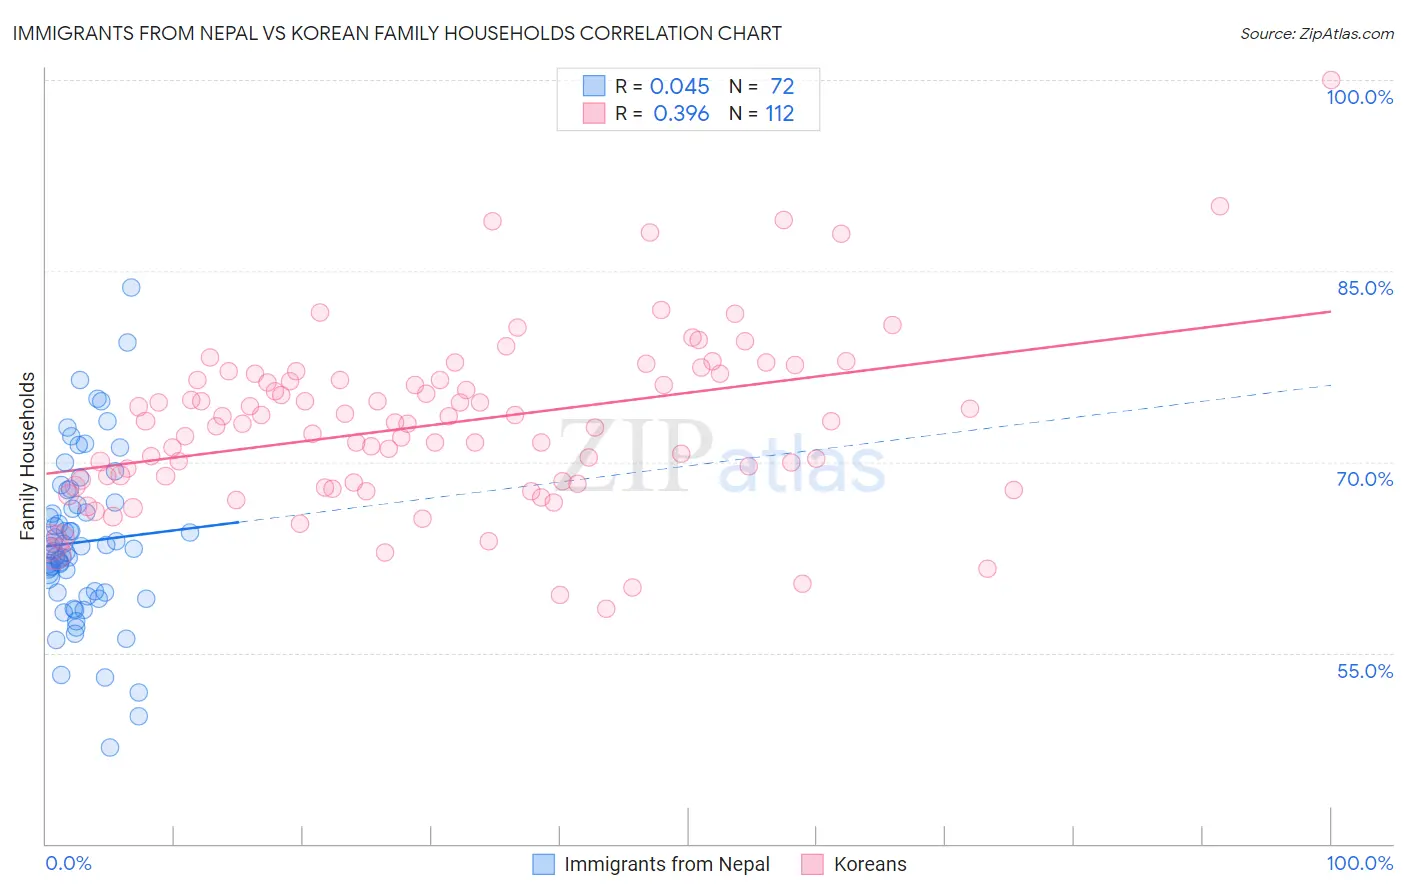
Immigrants from Nepal vs Korean Family Households Correlation Chart
The statistical analysis conducted on geographies consisting of 186,706,837 people shows no correlation between the proportion of Immigrants from Nepal and percentage of family households in the United States with a correlation coefficient (R) of 0.045 and weighted average of 62.7%. Similarly, the statistical analysis conducted on geographies consisting of 510,403,530 people shows a mild positive correlation between the proportion of Koreans and percentage of family households in the United States with a correlation coefficient (R) of 0.396 and weighted average of 68.3%, a difference of 8.9%.
Family Households Correlation Summary
| Measurement | Immigrants from Nepal | Korean |
| Minimum | 47.6% | 58.5% |
| Maximum | 83.7% | 100.0% |
| Range | 36.1% | 41.5% |
| Mean | 63.7% | 73.0% |
| Median | 63.3% | 73.1% |
| Interquartile 25% (IQ1) | 59.7% | 68.4% |
| Interquartile 75% (IQ3) | 66.7% | 76.5% |
| Interquartile Range (IQR) | 7.0% | 8.1% |
| Standard Deviation (Sample) | 6.5% | 6.7% |
| Standard Deviation (Population) | 6.4% | 6.7% |
Similar Demographics by Family Households
Demographics Similar to Immigrants from Nepal by Family Households
In terms of family households, the demographic groups most similar to Immigrants from Nepal are Immigrants from Grenada (62.6%, a difference of 0.080%), Immigrants from Uganda (62.7%, a difference of 0.090%), British West Indian (62.8%, a difference of 0.11%), Latvian (62.8%, a difference of 0.11%), and U.S. Virgin Islander (62.6%, a difference of 0.13%).
| Demographics | Rating | Rank | Family Households |
| New Zealanders | 0.1 /100 | #282 | Tragic 62.9% |
| Immigrants | Denmark | 0.1 /100 | #283 | Tragic 62.9% |
| Australians | 0.1 /100 | #284 | Tragic 62.8% |
| Mongolians | 0.1 /100 | #285 | Tragic 62.8% |
| British West Indians | 0.1 /100 | #286 | Tragic 62.8% |
| Latvians | 0.1 /100 | #287 | Tragic 62.8% |
| Immigrants | Uganda | 0.1 /100 | #288 | Tragic 62.7% |
| Immigrants | Nepal | 0.1 /100 | #289 | Tragic 62.7% |
| Immigrants | Grenada | 0.0 /100 | #290 | Tragic 62.6% |
| U.S. Virgin Islanders | 0.0 /100 | #291 | Tragic 62.6% |
| Immigrants | Burma/Myanmar | 0.0 /100 | #292 | Tragic 62.6% |
| Immigrants | Sweden | 0.0 /100 | #293 | Tragic 62.5% |
| Barbadians | 0.0 /100 | #294 | Tragic 62.5% |
| Okinawans | 0.0 /100 | #295 | Tragic 62.5% |
| Slovenes | 0.0 /100 | #296 | Tragic 62.4% |
Demographics Similar to Koreans by Family Households
In terms of family households, the demographic groups most similar to Koreans are Immigrants from Central America (68.3%, a difference of 0.030%), Pueblo (68.2%, a difference of 0.080%), Immigrants from Cuba (68.2%, a difference of 0.090%), Immigrants from Philippines (68.3%, a difference of 0.10%), and Assyrian/Chaldean/Syriac (68.2%, a difference of 0.15%).
| Demographics | Rating | Rank | Family Households |
| Yuman | 100.0 /100 | #5 | Exceptional 69.3% |
| Immigrants | Mexico | 100.0 /100 | #6 | Exceptional 69.1% |
| Mexicans | 100.0 /100 | #7 | Exceptional 69.0% |
| Immigrants | Fiji | 100.0 /100 | #8 | Exceptional 68.8% |
| Native Hawaiians | 100.0 /100 | #9 | Exceptional 68.4% |
| Immigrants | Philippines | 100.0 /100 | #10 | Exceptional 68.3% |
| Immigrants | Central America | 100.0 /100 | #11 | Exceptional 68.3% |
| Koreans | 100.0 /100 | #12 | Exceptional 68.3% |
| Pueblo | 100.0 /100 | #13 | Exceptional 68.2% |
| Immigrants | Cuba | 100.0 /100 | #14 | Exceptional 68.2% |
| Assyrians/Chaldeans/Syriacs | 100.0 /100 | #15 | Exceptional 68.2% |
| Immigrants | Vietnam | 100.0 /100 | #16 | Exceptional 68.2% |
| Chinese | 100.0 /100 | #17 | Exceptional 68.1% |
| Immigrants | Taiwan | 100.0 /100 | #18 | Exceptional 68.0% |
| Samoans | 100.0 /100 | #19 | Exceptional 67.9% |