Iranian vs Czechoslovakian Unemployment Among Women with Children Ages 6 to 17 years
COMPARE
Iranian
Czechoslovakian
Unemployment Among Women with Children Ages 6 to 17 years
Unemployment Among Women with Children Ages 6 to 17 years Comparison
Iranians
Czechoslovakians
8.0%
UNEMPLOYMENT AMONG WOMEN WITH CHILDREN AGES 6 TO 17 YEARS
100.0/ 100
METRIC RATING
41st/ 347
METRIC RANK
9.1%
UNEMPLOYMENT AMONG WOMEN WITH CHILDREN AGES 6 TO 17 YEARS
20.8/ 100
METRIC RATING
199th/ 347
METRIC RANK
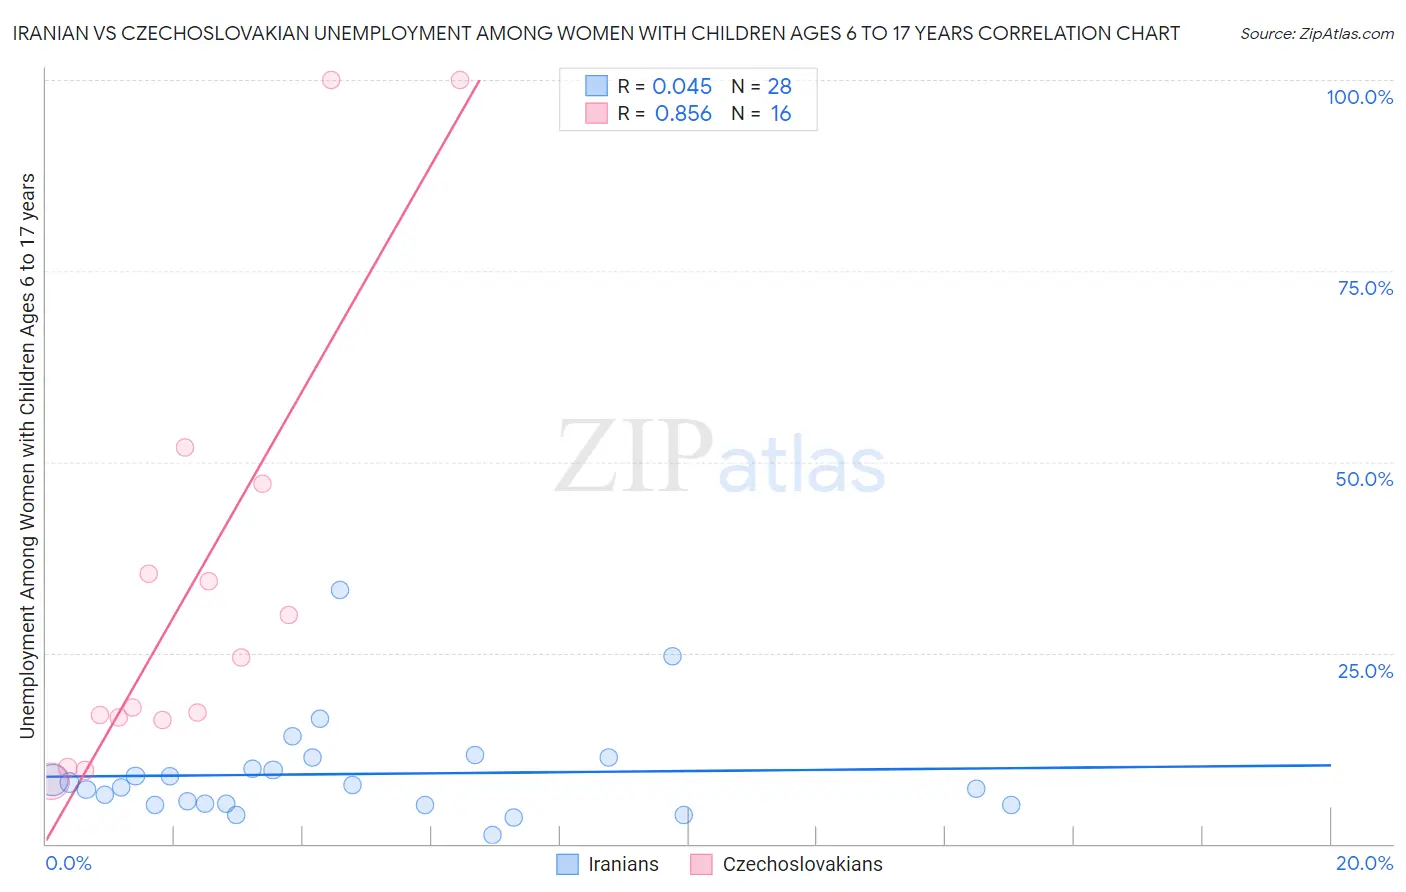
Iranian vs Czechoslovakian Unemployment Among Women with Children Ages 6 to 17 years Correlation Chart
The statistical analysis conducted on geographies consisting of 238,016,726 people shows no correlation between the proportion of Iranians and unemployment rate among women with children between the ages 6 and 17 in the United States with a correlation coefficient (R) of 0.045 and weighted average of 8.0%. Similarly, the statistical analysis conducted on geographies consisting of 258,773,734 people shows a very strong positive correlation between the proportion of Czechoslovakians and unemployment rate among women with children between the ages 6 and 17 in the United States with a correlation coefficient (R) of 0.856 and weighted average of 9.1%, a difference of 13.4%.
Unemployment Among Women with Children Ages 6 to 17 years Correlation Summary
| Measurement | Iranian | Czechoslovakian |
| Minimum | 1.2% | 8.3% |
| Maximum | 33.2% | 100.0% |
| Range | 32.0% | 91.7% |
| Mean | 9.1% | 33.5% |
| Median | 7.6% | 21.1% |
| Interquartile 25% (IQ1) | 5.2% | 16.3% |
| Interquartile 75% (IQ3) | 10.6% | 41.2% |
| Interquartile Range (IQR) | 5.4% | 24.9% |
| Standard Deviation (Sample) | 6.6% | 29.0% |
| Standard Deviation (Population) | 6.5% | 28.1% |
Similar Demographics by Unemployment Among Women with Children Ages 6 to 17 years
Demographics Similar to Iranians by Unemployment Among Women with Children Ages 6 to 17 years
In terms of unemployment among women with children ages 6 to 17 years, the demographic groups most similar to Iranians are Immigrants from Zimbabwe (8.0%, a difference of 0.070%), Immigrants from Somalia (8.0%, a difference of 0.27%), Somali (8.0%, a difference of 0.36%), Bhutanese (8.1%, a difference of 0.41%), and Immigrants from Sweden (8.1%, a difference of 0.45%).
| Demographics | Rating | Rank | Unemployment Among Women with Children Ages 6 to 17 years |
| Native Hawaiians | 100.0 /100 | #34 | Exceptional 7.9% |
| Immigrants | South Central Asia | 100.0 /100 | #35 | Exceptional 7.9% |
| Burmese | 100.0 /100 | #36 | Exceptional 8.0% |
| Asians | 100.0 /100 | #37 | Exceptional 8.0% |
| Alsatians | 100.0 /100 | #38 | Exceptional 8.0% |
| Somalis | 100.0 /100 | #39 | Exceptional 8.0% |
| Immigrants | Zimbabwe | 100.0 /100 | #40 | Exceptional 8.0% |
| Iranians | 100.0 /100 | #41 | Exceptional 8.0% |
| Immigrants | Somalia | 100.0 /100 | #42 | Exceptional 8.0% |
| Bhutanese | 100.0 /100 | #43 | Exceptional 8.1% |
| Immigrants | Sweden | 100.0 /100 | #44 | Exceptional 8.1% |
| Immigrants | Bulgaria | 100.0 /100 | #45 | Exceptional 8.1% |
| Icelanders | 100.0 /100 | #46 | Exceptional 8.1% |
| Immigrants | Switzerland | 100.0 /100 | #47 | Exceptional 8.1% |
| Immigrants | Asia | 100.0 /100 | #48 | Exceptional 8.1% |
Demographics Similar to Czechoslovakians by Unemployment Among Women with Children Ages 6 to 17 years
In terms of unemployment among women with children ages 6 to 17 years, the demographic groups most similar to Czechoslovakians are Guyanese (9.1%, a difference of 0.070%), Trinidadian and Tobagonian (9.1%, a difference of 0.18%), Immigrants from Panama (9.1%, a difference of 0.22%), Brazilian (9.1%, a difference of 0.23%), and Austrian (9.1%, a difference of 0.26%).
| Demographics | Rating | Rank | Unemployment Among Women with Children Ages 6 to 17 years |
| Guamanians/Chamorros | 27.2 /100 | #192 | Fair 9.1% |
| Immigrants | Turkey | 25.8 /100 | #193 | Fair 9.1% |
| Immigrants | Kazakhstan | 25.3 /100 | #194 | Fair 9.1% |
| Austrians | 25.0 /100 | #195 | Fair 9.1% |
| Brazilians | 24.4 /100 | #196 | Fair 9.1% |
| Immigrants | Panama | 24.3 /100 | #197 | Fair 9.1% |
| Guyanese | 21.8 /100 | #198 | Fair 9.1% |
| Czechoslovakians | 20.8 /100 | #199 | Fair 9.1% |
| Trinidadians and Tobagonians | 18.2 /100 | #200 | Poor 9.1% |
| Immigrants | Trinidad and Tobago | 16.7 /100 | #201 | Poor 9.1% |
| Immigrants | Middle Africa | 15.6 /100 | #202 | Poor 9.1% |
| Maltese | 15.3 /100 | #203 | Poor 9.1% |
| Immigrants | Canada | 15.3 /100 | #204 | Poor 9.1% |
| Immigrants | Western Europe | 14.1 /100 | #205 | Poor 9.1% |
| Immigrants | North America | 12.7 /100 | #206 | Poor 9.2% |