Indonesian vs Ugandan Single Mother Households
COMPARE
Indonesian
Ugandan
Single Mother Households
Single Mother Households Comparison
Indonesians
Ugandans
7.5%
SINGLE MOTHER HOUSEHOLDS
0.1/ 100
METRIC RATING
268th/ 347
METRIC RANK
6.5%
SINGLE MOTHER HOUSEHOLDS
25.6/ 100
METRIC RATING
185th/ 347
METRIC RANK
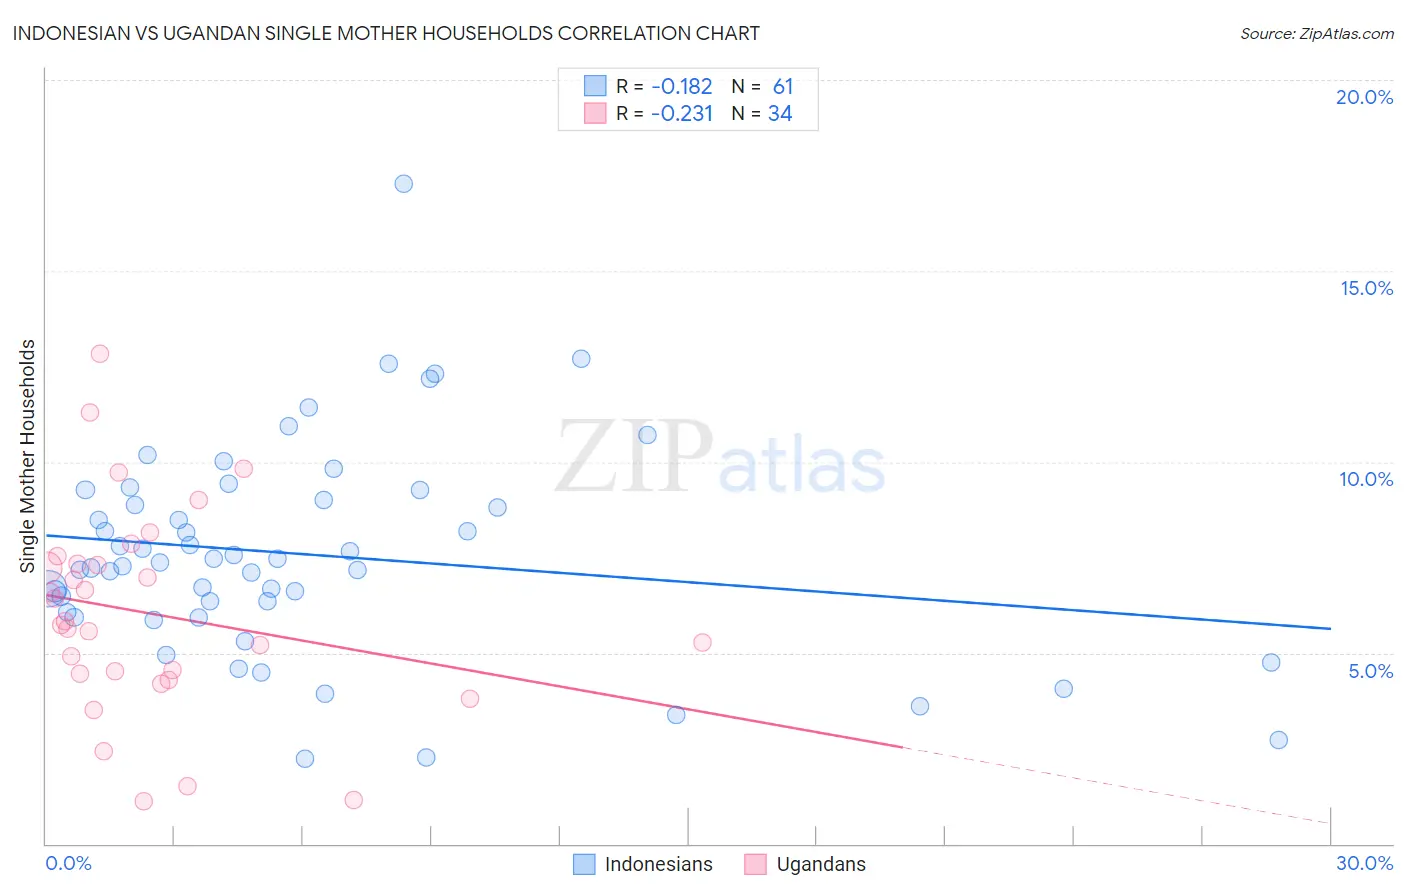
Indonesian vs Ugandan Single Mother Households Correlation Chart
The statistical analysis conducted on geographies consisting of 162,449,880 people shows a poor negative correlation between the proportion of Indonesians and percentage of single mother households in the United States with a correlation coefficient (R) of -0.182 and weighted average of 7.5%. Similarly, the statistical analysis conducted on geographies consisting of 93,972,955 people shows a weak negative correlation between the proportion of Ugandans and percentage of single mother households in the United States with a correlation coefficient (R) of -0.231 and weighted average of 6.5%, a difference of 15.2%.
Single Mother Households Correlation Summary
| Measurement | Indonesian | Ugandan |
| Minimum | 2.2% | 1.1% |
| Maximum | 17.3% | 12.8% |
| Range | 15.0% | 11.7% |
| Mean | 7.6% | 6.0% |
| Median | 7.4% | 5.8% |
| Interquartile 25% (IQ1) | 6.0% | 4.5% |
| Interquartile 75% (IQ3) | 9.1% | 7.3% |
| Interquartile Range (IQR) | 3.1% | 2.9% |
| Standard Deviation (Sample) | 2.8% | 2.7% |
| Standard Deviation (Population) | 2.7% | 2.6% |
Similar Demographics by Single Mother Households
Demographics Similar to Indonesians by Single Mother Households
In terms of single mother households, the demographic groups most similar to Indonesians are Blackfeet (7.5%, a difference of 0.040%), Nepalese (7.5%, a difference of 0.38%), Somali (7.5%, a difference of 0.41%), Crow (7.4%, a difference of 0.48%), and Immigrants from Cuba (7.5%, a difference of 0.58%).
| Demographics | Rating | Rank | Single Mother Households |
| Japanese | 0.2 /100 | #261 | Tragic 7.4% |
| Immigrants | Somalia | 0.2 /100 | #262 | Tragic 7.4% |
| Immigrants | Nicaragua | 0.2 /100 | #263 | Tragic 7.4% |
| Yaqui | 0.1 /100 | #264 | Tragic 7.4% |
| Crow | 0.1 /100 | #265 | Tragic 7.4% |
| Nepalese | 0.1 /100 | #266 | Tragic 7.5% |
| Blackfeet | 0.1 /100 | #267 | Tragic 7.5% |
| Indonesians | 0.1 /100 | #268 | Tragic 7.5% |
| Somalis | 0.1 /100 | #269 | Tragic 7.5% |
| Immigrants | Cuba | 0.1 /100 | #270 | Tragic 7.5% |
| Salvadorans | 0.1 /100 | #271 | Tragic 7.5% |
| Immigrants | Azores | 0.1 /100 | #272 | Tragic 7.5% |
| Belizeans | 0.1 /100 | #273 | Tragic 7.6% |
| Immigrants | Guyana | 0.1 /100 | #274 | Tragic 7.6% |
| Central American Indians | 0.1 /100 | #275 | Tragic 7.6% |
Demographics Similar to Ugandans by Single Mother Households
In terms of single mother households, the demographic groups most similar to Ugandans are Ethiopian (6.5%, a difference of 0.060%), Costa Rican (6.5%, a difference of 0.11%), Immigrants from Afghanistan (6.5%, a difference of 0.13%), Ottawa (6.5%, a difference of 0.26%), and Spaniard (6.5%, a difference of 0.30%).
| Demographics | Rating | Rank | Single Mother Households |
| Portuguese | 40.0 /100 | #178 | Fair 6.4% |
| Hmong | 39.8 /100 | #179 | Fair 6.4% |
| Immigrants | Nepal | 36.1 /100 | #180 | Fair 6.4% |
| Spanish | 33.4 /100 | #181 | Fair 6.4% |
| South American Indians | 33.4 /100 | #182 | Fair 6.4% |
| Spaniards | 27.8 /100 | #183 | Fair 6.5% |
| Ethiopians | 26.0 /100 | #184 | Fair 6.5% |
| Ugandans | 25.6 /100 | #185 | Fair 6.5% |
| Costa Ricans | 24.8 /100 | #186 | Fair 6.5% |
| Immigrants | Afghanistan | 24.7 /100 | #187 | Fair 6.5% |
| Ottawa | 23.8 /100 | #188 | Fair 6.5% |
| Delaware | 23.3 /100 | #189 | Fair 6.5% |
| Peruvians | 21.6 /100 | #190 | Fair 6.5% |
| Samoans | 21.2 /100 | #191 | Fair 6.5% |
| Americans | 19.0 /100 | #192 | Poor 6.6% |