Indonesian vs Immigrants from Barbados Unemployment Among Ages 16 to 19 years
COMPARE
Indonesian
Immigrants from Barbados
Unemployment Among Ages 16 to 19 years
Unemployment Among Ages 16 to 19 years Comparison
Indonesians
Immigrants from Barbados
15.5%
UNEMPLOYMENT AMONG AGES 16 TO 19 YEARS
100.0/ 100
METRIC RATING
11th/ 347
METRIC RANK
24.0%
UNEMPLOYMENT AMONG AGES 16 TO 19 YEARS
0.0/ 100
METRIC RATING
332nd/ 347
METRIC RANK
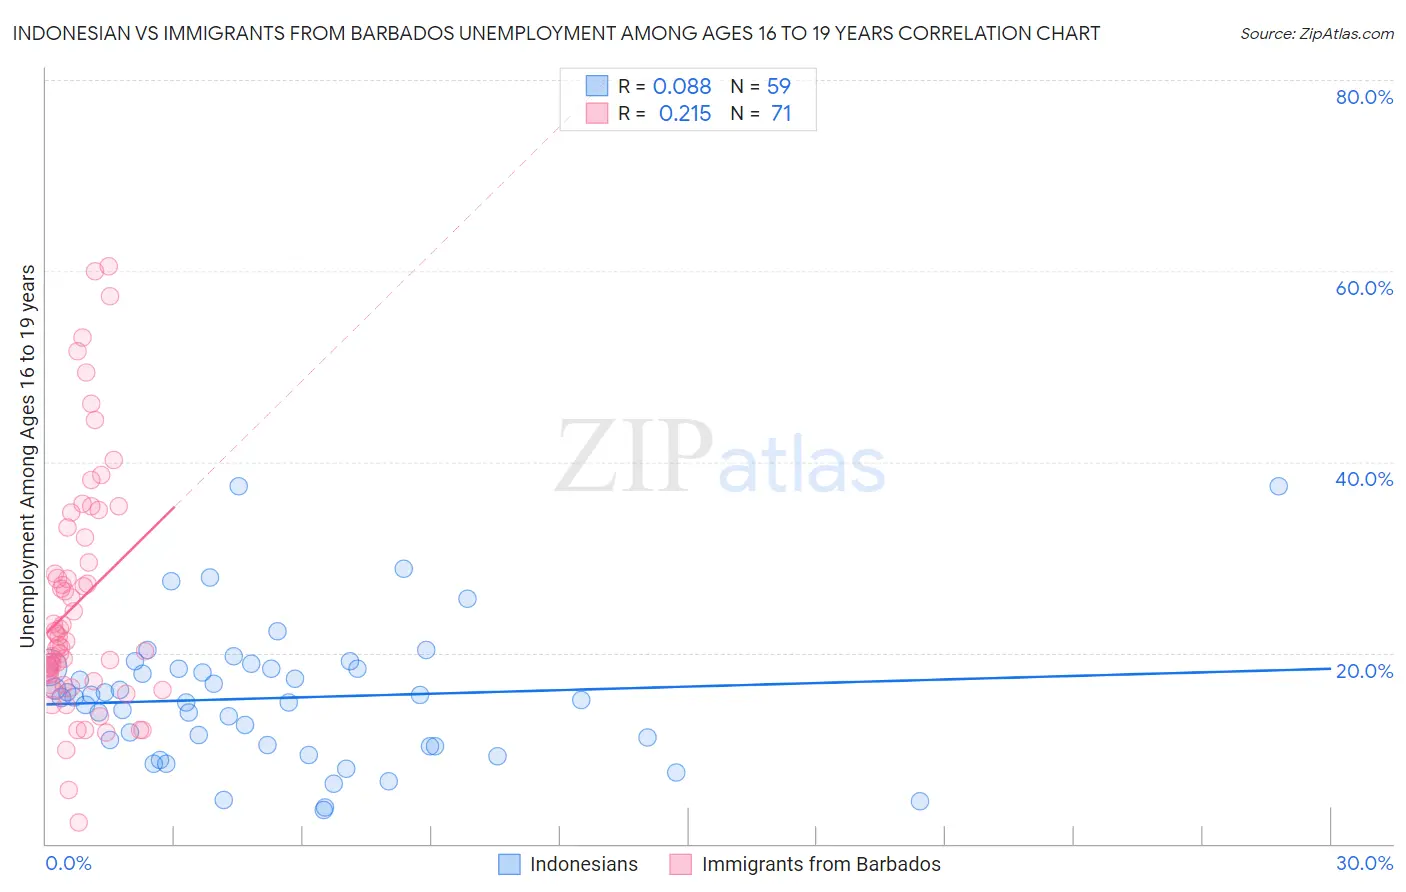
Indonesian vs Immigrants from Barbados Unemployment Among Ages 16 to 19 years Correlation Chart
The statistical analysis conducted on geographies consisting of 159,445,213 people shows a slight positive correlation between the proportion of Indonesians and unemployment rate among population between the ages 16 and 19 in the United States with a correlation coefficient (R) of 0.088 and weighted average of 15.5%. Similarly, the statistical analysis conducted on geographies consisting of 110,917,290 people shows a weak positive correlation between the proportion of Immigrants from Barbados and unemployment rate among population between the ages 16 and 19 in the United States with a correlation coefficient (R) of 0.215 and weighted average of 24.0%, a difference of 54.8%.
Unemployment Among Ages 16 to 19 years Correlation Summary
| Measurement | Indonesian | Immigrants from Barbados |
| Minimum | 3.6% | 2.2% |
| Maximum | 37.5% | 60.5% |
| Range | 33.9% | 58.3% |
| Mean | 15.3% | 25.3% |
| Median | 15.3% | 21.2% |
| Interquartile 25% (IQ1) | 10.2% | 17.0% |
| Interquartile 75% (IQ3) | 18.3% | 32.1% |
| Interquartile Range (IQR) | 8.1% | 15.1% |
| Standard Deviation (Sample) | 7.1% | 12.7% |
| Standard Deviation (Population) | 7.1% | 12.6% |
Similar Demographics by Unemployment Among Ages 16 to 19 years
Demographics Similar to Indonesians by Unemployment Among Ages 16 to 19 years
In terms of unemployment among ages 16 to 19 years, the demographic groups most similar to Indonesians are Taiwanese (15.5%, a difference of 0.10%), Zimbabwean (15.4%, a difference of 0.42%), Scandinavian (15.4%, a difference of 0.53%), Immigrants from Burma/Myanmar (15.6%, a difference of 0.53%), and Immigrants from Zaire (15.6%, a difference of 0.68%).
| Demographics | Rating | Rank | Unemployment Among Ages 16 to 19 years |
| Danes | 100.0 /100 | #4 | Exceptional 15.2% |
| Immigrants | Somalia | 100.0 /100 | #5 | Exceptional 15.3% |
| Swedes | 100.0 /100 | #6 | Exceptional 15.3% |
| Immigrants | Bosnia and Herzegovina | 100.0 /100 | #7 | Exceptional 15.3% |
| Czechs | 100.0 /100 | #8 | Exceptional 15.4% |
| Scandinavians | 100.0 /100 | #9 | Exceptional 15.4% |
| Zimbabweans | 100.0 /100 | #10 | Exceptional 15.4% |
| Indonesians | 100.0 /100 | #11 | Exceptional 15.5% |
| Taiwanese | 100.0 /100 | #12 | Exceptional 15.5% |
| Immigrants | Burma/Myanmar | 100.0 /100 | #13 | Exceptional 15.6% |
| Immigrants | Zaire | 100.0 /100 | #14 | Exceptional 15.6% |
| Yugoslavians | 100.0 /100 | #15 | Exceptional 15.6% |
| Germans | 100.0 /100 | #16 | Exceptional 15.7% |
| Somalis | 100.0 /100 | #17 | Exceptional 15.7% |
| Thais | 100.0 /100 | #18 | Exceptional 15.7% |
Demographics Similar to Immigrants from Barbados by Unemployment Among Ages 16 to 19 years
In terms of unemployment among ages 16 to 19 years, the demographic groups most similar to Immigrants from Barbados are British West Indian (24.0%, a difference of 0.17%), Paiute (24.4%, a difference of 1.4%), Dominican (23.6%, a difference of 1.6%), Tlingit-Haida (23.5%, a difference of 2.0%), and Immigrants from Dominican Republic (23.3%, a difference of 3.1%).
| Demographics | Rating | Rank | Unemployment Among Ages 16 to 19 years |
| Trinidadians and Tobagonians | 0.0 /100 | #325 | Tragic 22.6% |
| Immigrants | Trinidad and Tobago | 0.0 /100 | #326 | Tragic 23.1% |
| Pima | 0.0 /100 | #327 | Tragic 23.1% |
| Immigrants | Dominican Republic | 0.0 /100 | #328 | Tragic 23.3% |
| Tlingit-Haida | 0.0 /100 | #329 | Tragic 23.5% |
| Dominicans | 0.0 /100 | #330 | Tragic 23.6% |
| British West Indians | 0.0 /100 | #331 | Tragic 24.0% |
| Immigrants | Barbados | 0.0 /100 | #332 | Tragic 24.0% |
| Paiute | 0.0 /100 | #333 | Tragic 24.4% |
| Guyanese | 0.0 /100 | #334 | Tragic 24.8% |
| Arapaho | 0.0 /100 | #335 | Tragic 25.2% |
| Kiowa | 0.0 /100 | #336 | Tragic 25.2% |
| Immigrants | Guyana | 0.0 /100 | #337 | Tragic 25.5% |
| Immigrants | St. Vincent and the Grenadines | 0.0 /100 | #338 | Tragic 25.7% |
| Immigrants | Grenada | 0.0 /100 | #339 | Tragic 25.7% |