Indonesian vs Haitian Single Mother Households
COMPARE
Indonesian
Haitian
Single Mother Households
Single Mother Households Comparison
Indonesians
Haitians
7.5%
SINGLE MOTHER HOUSEHOLDS
0.1/ 100
METRIC RATING
268th/ 347
METRIC RANK
8.3%
SINGLE MOTHER HOUSEHOLDS
0.0/ 100
METRIC RATING
323rd/ 347
METRIC RANK
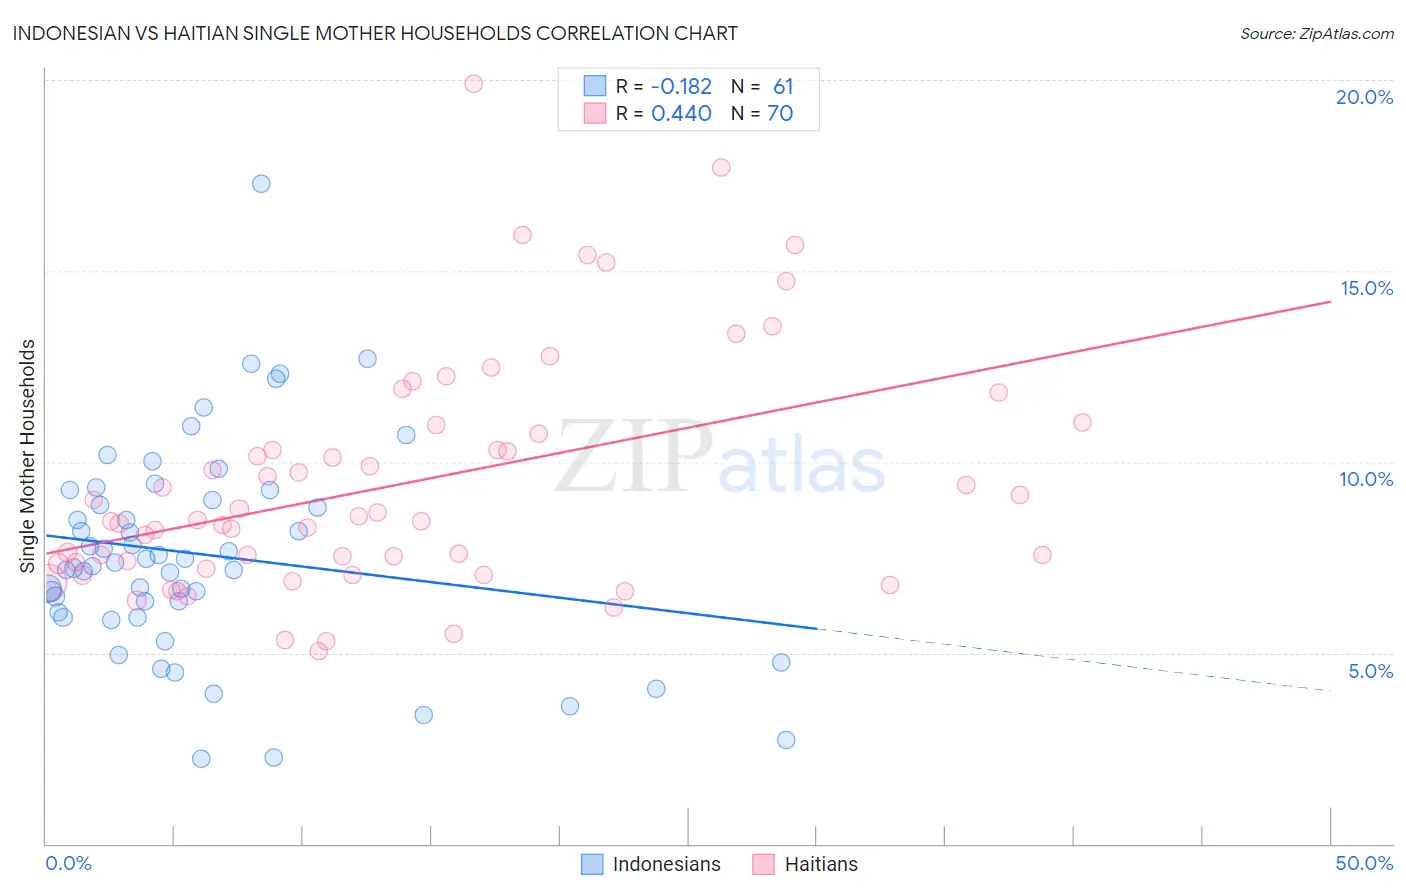
Indonesian vs Haitian Single Mother Households Correlation Chart
The statistical analysis conducted on geographies consisting of 162,449,880 people shows a poor negative correlation between the proportion of Indonesians and percentage of single mother households in the United States with a correlation coefficient (R) of -0.182 and weighted average of 7.5%. Similarly, the statistical analysis conducted on geographies consisting of 287,337,038 people shows a moderate positive correlation between the proportion of Haitians and percentage of single mother households in the United States with a correlation coefficient (R) of 0.440 and weighted average of 8.3%, a difference of 11.2%.
Single Mother Households Correlation Summary
| Measurement | Indonesian | Haitian |
| Minimum | 2.2% | 5.1% |
| Maximum | 17.3% | 19.9% |
| Range | 15.0% | 14.9% |
| Mean | 7.6% | 9.4% |
| Median | 7.4% | 8.5% |
| Interquartile 25% (IQ1) | 6.0% | 7.3% |
| Interquartile 75% (IQ3) | 9.1% | 10.7% |
| Interquartile Range (IQR) | 3.1% | 3.4% |
| Standard Deviation (Sample) | 2.8% | 3.1% |
| Standard Deviation (Population) | 2.7% | 3.1% |
Similar Demographics by Single Mother Households
Demographics Similar to Indonesians by Single Mother Households
In terms of single mother households, the demographic groups most similar to Indonesians are Blackfeet (7.5%, a difference of 0.040%), Nepalese (7.5%, a difference of 0.38%), Somali (7.5%, a difference of 0.41%), Crow (7.4%, a difference of 0.48%), and Immigrants from Cuba (7.5%, a difference of 0.58%).
| Demographics | Rating | Rank | Single Mother Households |
| Japanese | 0.2 /100 | #261 | Tragic 7.4% |
| Immigrants | Somalia | 0.2 /100 | #262 | Tragic 7.4% |
| Immigrants | Nicaragua | 0.2 /100 | #263 | Tragic 7.4% |
| Yaqui | 0.1 /100 | #264 | Tragic 7.4% |
| Crow | 0.1 /100 | #265 | Tragic 7.4% |
| Nepalese | 0.1 /100 | #266 | Tragic 7.5% |
| Blackfeet | 0.1 /100 | #267 | Tragic 7.5% |
| Indonesians | 0.1 /100 | #268 | Tragic 7.5% |
| Somalis | 0.1 /100 | #269 | Tragic 7.5% |
| Immigrants | Cuba | 0.1 /100 | #270 | Tragic 7.5% |
| Salvadorans | 0.1 /100 | #271 | Tragic 7.5% |
| Immigrants | Azores | 0.1 /100 | #272 | Tragic 7.5% |
| Belizeans | 0.1 /100 | #273 | Tragic 7.6% |
| Immigrants | Guyana | 0.1 /100 | #274 | Tragic 7.6% |
| Central American Indians | 0.1 /100 | #275 | Tragic 7.6% |
Demographics Similar to Haitians by Single Mother Households
In terms of single mother households, the demographic groups most similar to Haitians are Immigrants from Jamaica (8.4%, a difference of 0.43%), Pima (8.3%, a difference of 0.53%), Immigrants from Senegal (8.3%, a difference of 0.61%), Immigrants from Caribbean (8.4%, a difference of 0.61%), and British West Indian (8.4%, a difference of 0.74%).
| Demographics | Rating | Rank | Single Mother Households |
| Africans | 0.0 /100 | #316 | Tragic 8.2% |
| Immigrants | Honduras | 0.0 /100 | #317 | Tragic 8.2% |
| Senegalese | 0.0 /100 | #318 | Tragic 8.2% |
| Jamaicans | 0.0 /100 | #319 | Tragic 8.2% |
| Bahamians | 0.0 /100 | #320 | Tragic 8.3% |
| Immigrants | Senegal | 0.0 /100 | #321 | Tragic 8.3% |
| Pima | 0.0 /100 | #322 | Tragic 8.3% |
| Haitians | 0.0 /100 | #323 | Tragic 8.3% |
| Immigrants | Jamaica | 0.0 /100 | #324 | Tragic 8.4% |
| Immigrants | Caribbean | 0.0 /100 | #325 | Tragic 8.4% |
| British West Indians | 0.0 /100 | #326 | Tragic 8.4% |
| Immigrants | Haiti | 0.0 /100 | #327 | Tragic 8.4% |
| Yakama | 0.0 /100 | #328 | Tragic 8.4% |
| Hopi | 0.0 /100 | #329 | Tragic 8.5% |
| Inupiat | 0.0 /100 | #330 | Tragic 8.5% |