Immigrants from Grenada vs Ecuadorian Average Family Size
COMPARE
Immigrants from Grenada
Ecuadorian
Average Family Size
Average Family Size Comparison
Immigrants from Grenada
Ecuadorians
3.34
AVERAGE FAMILY SIZE
100.0/ 100
METRIC RATING
62nd/ 347
METRIC RANK
3.32
AVERAGE FAMILY SIZE
99.8/ 100
METRIC RATING
82nd/ 347
METRIC RANK
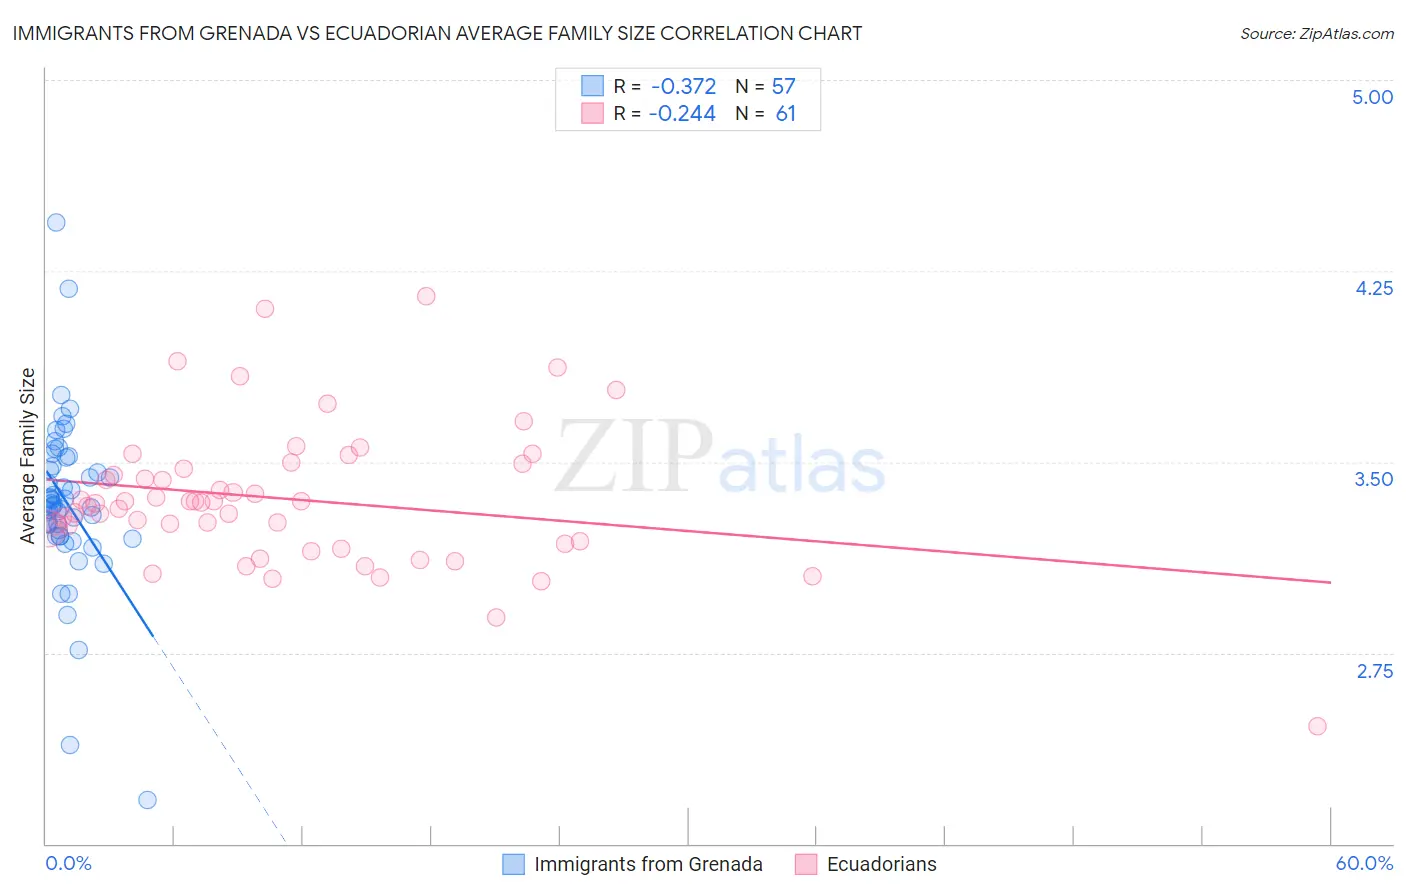
Immigrants from Grenada vs Ecuadorian Average Family Size Correlation Chart
The statistical analysis conducted on geographies consisting of 67,189,874 people shows a mild negative correlation between the proportion of Immigrants from Grenada and average family size in the United States with a correlation coefficient (R) of -0.372 and weighted average of 3.34. Similarly, the statistical analysis conducted on geographies consisting of 317,647,749 people shows a weak negative correlation between the proportion of Ecuadorians and average family size in the United States with a correlation coefficient (R) of -0.244 and weighted average of 3.32, a difference of 0.72%.
Average Family Size Correlation Summary
| Measurement | Immigrants from Grenada | Ecuadorian |
| Minimum | 2.17 | 2.46 |
| Maximum | 4.44 | 4.15 |
| Range | 2.27 | 1.69 |
| Mean | 3.34 | 3.35 |
| Median | 3.33 | 3.34 |
| Interquartile 25% (IQ1) | 3.21 | 3.19 |
| Interquartile 75% (IQ3) | 3.50 | 3.48 |
| Interquartile Range (IQR) | 0.29 | 0.30 |
| Standard Deviation (Sample) | 0.34 | 0.28 |
| Standard Deviation (Population) | 0.33 | 0.28 |
Demographics Similar to Immigrants from Grenada and Ecuadorians by Average Family Size
In terms of average family size, the demographic groups most similar to Immigrants from Grenada are Chinese (3.34, a difference of 0.020%), Dominican (3.34, a difference of 0.090%), Immigrants from Laos (3.34, a difference of 0.11%), Immigrants from St. Vincent and the Grenadines (3.34, a difference of 0.17%), and Immigrants from Jamaica (3.33, a difference of 0.21%). Similarly, the demographic groups most similar to Ecuadorians are Immigrants from Dominica (3.32, a difference of 0.040%), Lumbee (3.32, a difference of 0.080%), British West Indian (3.32, a difference of 0.10%), Immigrants from Micronesia (3.32, a difference of 0.11%), and Immigrants from Ecuador (3.32, a difference of 0.15%).
| Demographics | Rating | Rank | Average Family Size |
| Immigrants | Grenada | 100.0 /100 | #62 | Exceptional 3.34 |
| Chinese | 100.0 /100 | #63 | Exceptional 3.34 |
| Dominicans | 99.9 /100 | #64 | Exceptional 3.34 |
| Immigrants | Laos | 99.9 /100 | #65 | Exceptional 3.34 |
| Immigrants | St. Vincent and the Grenadines | 99.9 /100 | #66 | Exceptional 3.34 |
| Immigrants | Jamaica | 99.9 /100 | #67 | Exceptional 3.33 |
| Immigrants | Cambodia | 99.9 /100 | #68 | Exceptional 3.33 |
| Immigrants | Immigrants | 99.9 /100 | #69 | Exceptional 3.33 |
| Immigrants | Trinidad and Tobago | 99.9 /100 | #70 | Exceptional 3.33 |
| Immigrants | West Indies | 99.9 /100 | #71 | Exceptional 3.33 |
| Immigrants | Caribbean | 99.9 /100 | #72 | Exceptional 3.33 |
| Yaqui | 99.9 /100 | #73 | Exceptional 3.32 |
| Immigrants | Sierra Leone | 99.9 /100 | #74 | Exceptional 3.32 |
| Immigrants | Barbados | 99.8 /100 | #75 | Exceptional 3.32 |
| Trinidadians and Tobagonians | 99.8 /100 | #76 | Exceptional 3.32 |
| Immigrants | Ecuador | 99.8 /100 | #77 | Exceptional 3.32 |
| Immigrants | Micronesia | 99.8 /100 | #78 | Exceptional 3.32 |
| British West Indians | 99.8 /100 | #79 | Exceptional 3.32 |
| Lumbee | 99.8 /100 | #80 | Exceptional 3.32 |
| Immigrants | Dominica | 99.8 /100 | #81 | Exceptional 3.32 |
| Ecuadorians | 99.8 /100 | #82 | Exceptional 3.32 |