Estonian vs Ecuadorian Average Family Size
COMPARE
Estonian
Ecuadorian
Average Family Size
Average Family Size Comparison
Estonians
Ecuadorians
3.10
AVERAGE FAMILY SIZE
0.0/ 100
METRIC RATING
333rd/ 347
METRIC RANK
3.32
AVERAGE FAMILY SIZE
99.8/ 100
METRIC RATING
82nd/ 347
METRIC RANK
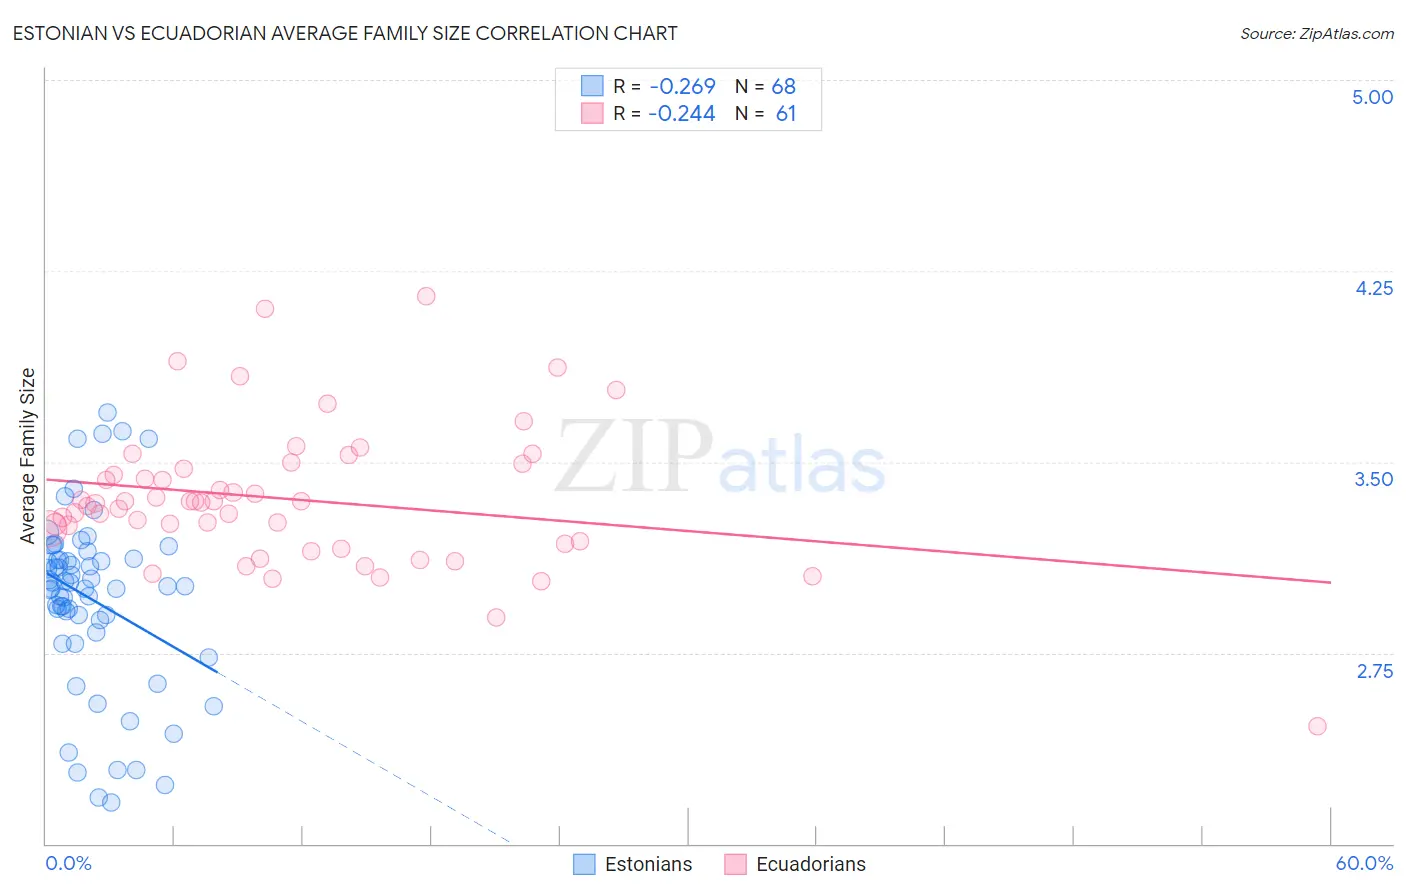
Estonian vs Ecuadorian Average Family Size Correlation Chart
The statistical analysis conducted on geographies consisting of 123,500,786 people shows a weak negative correlation between the proportion of Estonians and average family size in the United States with a correlation coefficient (R) of -0.269 and weighted average of 3.10. Similarly, the statistical analysis conducted on geographies consisting of 317,647,749 people shows a weak negative correlation between the proportion of Ecuadorians and average family size in the United States with a correlation coefficient (R) of -0.244 and weighted average of 3.32, a difference of 6.9%.
Average Family Size Correlation Summary
| Measurement | Estonian | Ecuadorian |
| Minimum | 2.16 | 2.46 |
| Maximum | 3.69 | 4.15 |
| Range | 1.53 | 1.69 |
| Mean | 2.96 | 3.35 |
| Median | 3.01 | 3.34 |
| Interquartile 25% (IQ1) | 2.85 | 3.19 |
| Interquartile 75% (IQ3) | 3.12 | 3.48 |
| Interquartile Range (IQR) | 0.26 | 0.30 |
| Standard Deviation (Sample) | 0.35 | 0.28 |
| Standard Deviation (Population) | 0.34 | 0.28 |
Similar Demographics by Average Family Size
Demographics Similar to Estonians by Average Family Size
In terms of average family size, the demographic groups most similar to Estonians are Lithuanian (3.10, a difference of 0.0%), Luxembourger (3.10, a difference of 0.030%), Latvian (3.11, a difference of 0.050%), Scotch-Irish (3.11, a difference of 0.050%), and Scottish (3.11, a difference of 0.050%).
| Demographics | Rating | Rank | Average Family Size |
| Ottawa | 0.0 /100 | #326 | Tragic 3.11 |
| Dutch | 0.0 /100 | #327 | Tragic 3.11 |
| Czechs | 0.0 /100 | #328 | Tragic 3.11 |
| Belgians | 0.0 /100 | #329 | Tragic 3.11 |
| Latvians | 0.0 /100 | #330 | Tragic 3.11 |
| Scotch-Irish | 0.0 /100 | #331 | Tragic 3.11 |
| Scottish | 0.0 /100 | #332 | Tragic 3.11 |
| Estonians | 0.0 /100 | #333 | Tragic 3.10 |
| Lithuanians | 0.0 /100 | #334 | Tragic 3.10 |
| Luxembourgers | 0.0 /100 | #335 | Tragic 3.10 |
| Irish | 0.0 /100 | #336 | Tragic 3.10 |
| Swedes | 0.0 /100 | #337 | Tragic 3.10 |
| French | 0.0 /100 | #338 | Tragic 3.10 |
| Croatians | 0.0 /100 | #339 | Tragic 3.10 |
| Finns | 0.0 /100 | #340 | Tragic 3.09 |
Demographics Similar to Ecuadorians by Average Family Size
In terms of average family size, the demographic groups most similar to Ecuadorians are Immigrants from Afghanistan (3.32, a difference of 0.010%), Immigrants from Dominica (3.32, a difference of 0.040%), Immigrants from Nigeria (3.32, a difference of 0.050%), Lumbee (3.32, a difference of 0.080%), and Afghan (3.31, a difference of 0.090%).
| Demographics | Rating | Rank | Average Family Size |
| Immigrants | Barbados | 99.8 /100 | #75 | Exceptional 3.32 |
| Trinidadians and Tobagonians | 99.8 /100 | #76 | Exceptional 3.32 |
| Immigrants | Ecuador | 99.8 /100 | #77 | Exceptional 3.32 |
| Immigrants | Micronesia | 99.8 /100 | #78 | Exceptional 3.32 |
| British West Indians | 99.8 /100 | #79 | Exceptional 3.32 |
| Lumbee | 99.8 /100 | #80 | Exceptional 3.32 |
| Immigrants | Dominica | 99.8 /100 | #81 | Exceptional 3.32 |
| Ecuadorians | 99.8 /100 | #82 | Exceptional 3.32 |
| Immigrants | Afghanistan | 99.8 /100 | #83 | Exceptional 3.32 |
| Immigrants | Nigeria | 99.7 /100 | #84 | Exceptional 3.32 |
| Afghans | 99.7 /100 | #85 | Exceptional 3.31 |
| Jamaicans | 99.7 /100 | #86 | Exceptional 3.31 |
| Immigrants | Peru | 99.7 /100 | #87 | Exceptional 3.31 |
| Immigrants | Bolivia | 99.6 /100 | #88 | Exceptional 3.31 |
| Malaysians | 99.6 /100 | #89 | Exceptional 3.31 |