Immigrants vs Immigrants from Uganda Single Father Households
COMPARE
Immigrants
Immigrants from Uganda
Single Father Households
Single Father Households Comparison
Immigrants
Immigrants from Uganda
2.5%
SINGLE FATHER HOUSEHOLDS
6.3/ 100
METRIC RATING
235th/ 347
METRIC RANK
2.4%
SINGLE FATHER HOUSEHOLDS
26.0/ 100
METRIC RATING
201st/ 347
METRIC RANK
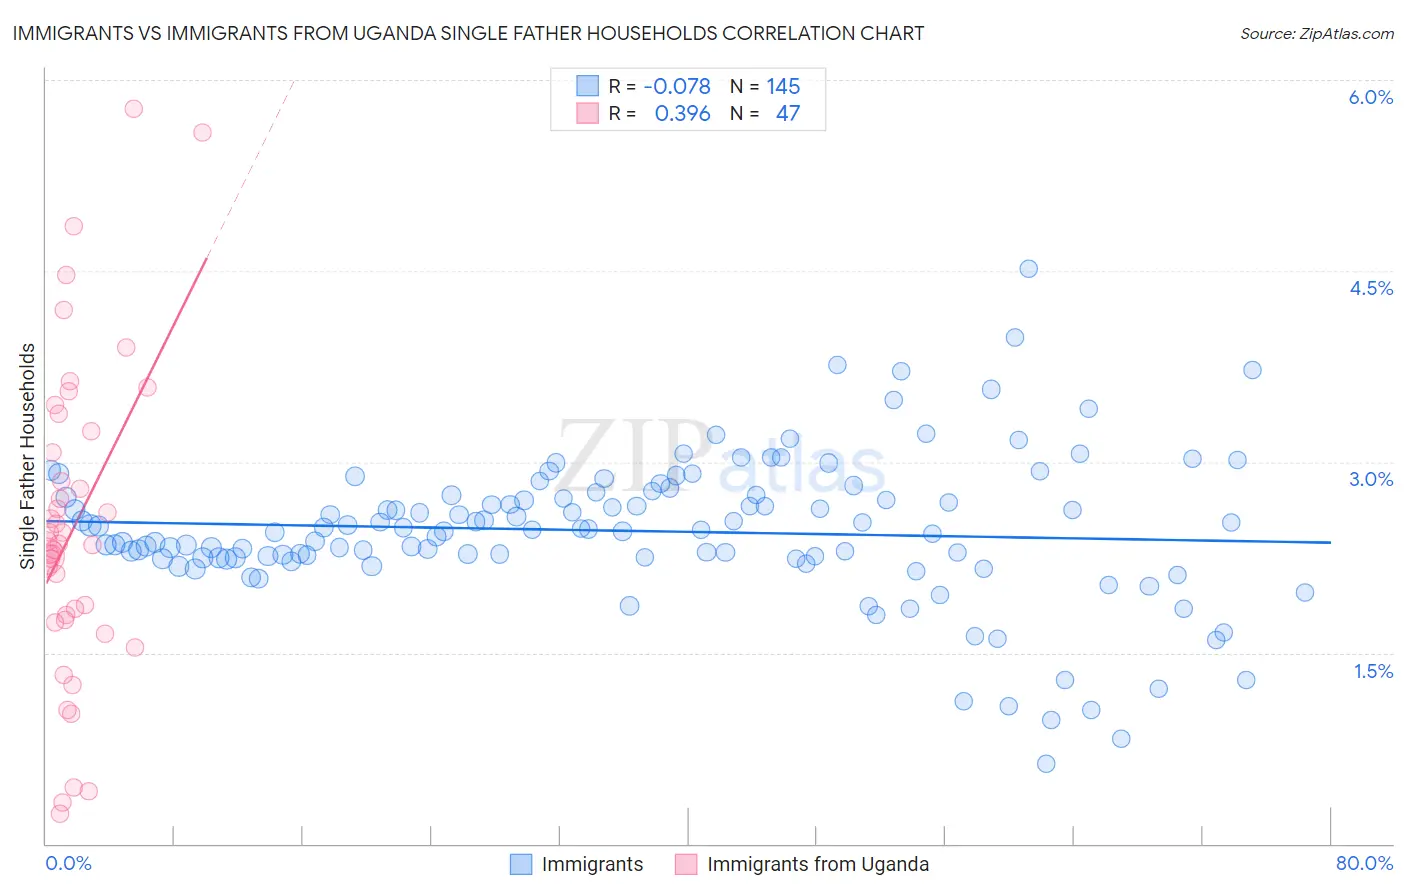
Immigrants vs Immigrants from Uganda Single Father Households Correlation Chart
The statistical analysis conducted on geographies consisting of 561,636,602 people shows a slight negative correlation between the proportion of Immigrants and percentage of single father households in the United States with a correlation coefficient (R) of -0.078 and weighted average of 2.5%. Similarly, the statistical analysis conducted on geographies consisting of 125,685,639 people shows a mild positive correlation between the proportion of Immigrants from Uganda and percentage of single father households in the United States with a correlation coefficient (R) of 0.396 and weighted average of 2.4%, a difference of 3.0%.
Single Father Households Correlation Summary
| Measurement | Immigrants | Immigrants from Uganda |
| Minimum | 0.62% | 0.24% |
| Maximum | 4.5% | 5.8% |
| Range | 3.9% | 5.5% |
| Mean | 2.5% | 2.5% |
| Median | 2.5% | 2.4% |
| Interquartile 25% (IQ1) | 2.2% | 1.8% |
| Interquartile 75% (IQ3) | 2.7% | 3.2% |
| Interquartile Range (IQR) | 0.49% | 1.5% |
| Standard Deviation (Sample) | 0.58% | 1.2% |
| Standard Deviation (Population) | 0.58% | 1.2% |
Similar Demographics by Single Father Households
Demographics Similar to Immigrants by Single Father Households
In terms of single father households, the demographic groups most similar to Immigrants are African (2.5%, a difference of 0.020%), Cajun (2.5%, a difference of 0.050%), Sierra Leonean (2.5%, a difference of 0.10%), Immigrants from Sierra Leone (2.5%, a difference of 0.13%), and Immigrants from Oceania (2.5%, a difference of 0.14%).
| Demographics | Rating | Rank | Single Father Households |
| Immigrants | Ghana | 9.1 /100 | #228 | Tragic 2.4% |
| Immigrants | Zaire | 8.6 /100 | #229 | Tragic 2.4% |
| Sub-Saharan Africans | 8.3 /100 | #230 | Tragic 2.4% |
| Immigrants | Nonimmigrants | 7.6 /100 | #231 | Tragic 2.4% |
| Pennsylvania Germans | 7.3 /100 | #232 | Tragic 2.4% |
| Immigrants | Western Africa | 7.0 /100 | #233 | Tragic 2.4% |
| Africans | 6.3 /100 | #234 | Tragic 2.5% |
| Immigrants | Immigrants | 6.3 /100 | #235 | Tragic 2.5% |
| Cajuns | 6.1 /100 | #236 | Tragic 2.5% |
| Sierra Leoneans | 5.9 /100 | #237 | Tragic 2.5% |
| Immigrants | Sierra Leone | 5.8 /100 | #238 | Tragic 2.5% |
| Immigrants | Oceania | 5.8 /100 | #239 | Tragic 2.5% |
| Immigrants | Dominica | 4.8 /100 | #240 | Tragic 2.5% |
| Portuguese | 4.1 /100 | #241 | Tragic 2.5% |
| Osage | 4.1 /100 | #242 | Tragic 2.5% |
Demographics Similar to Immigrants from Uganda by Single Father Households
In terms of single father households, the demographic groups most similar to Immigrants from Uganda are German Russian (2.4%, a difference of 0.030%), Immigrants from Vietnam (2.4%, a difference of 0.10%), Peruvian (2.4%, a difference of 0.10%), Scandinavian (2.4%, a difference of 0.13%), and French Canadian (2.4%, a difference of 0.13%).
| Demographics | Rating | Rank | Single Father Households |
| Panamanians | 29.6 /100 | #194 | Fair 2.4% |
| Immigrants | Philippines | 28.7 /100 | #195 | Fair 2.4% |
| Kenyans | 28.0 /100 | #196 | Fair 2.4% |
| Germans | 28.0 /100 | #197 | Fair 2.4% |
| Scandinavians | 27.4 /100 | #198 | Fair 2.4% |
| Immigrants | Vietnam | 27.1 /100 | #199 | Fair 2.4% |
| Peruvians | 27.1 /100 | #200 | Fair 2.4% |
| Immigrants | Uganda | 26.0 /100 | #201 | Fair 2.4% |
| German Russians | 25.7 /100 | #202 | Fair 2.4% |
| French Canadians | 24.7 /100 | #203 | Fair 2.4% |
| Ecuadorians | 24.5 /100 | #204 | Fair 2.4% |
| Immigrants | Afghanistan | 24.2 /100 | #205 | Fair 2.4% |
| Koreans | 24.1 /100 | #206 | Fair 2.4% |
| Whites/Caucasians | 22.6 /100 | #207 | Fair 2.4% |
| Immigrants | Kenya | 20.3 /100 | #208 | Fair 2.4% |