Immigrants vs Finnish Single Father Households
COMPARE
Immigrants
Finnish
Single Father Households
Single Father Households Comparison
Immigrants
Finns
2.5%
SINGLE FATHER HOUSEHOLDS
6.3/ 100
METRIC RATING
235th/ 347
METRIC RANK
2.4%
SINGLE FATHER HOUSEHOLDS
18.3/ 100
METRIC RATING
212th/ 347
METRIC RANK
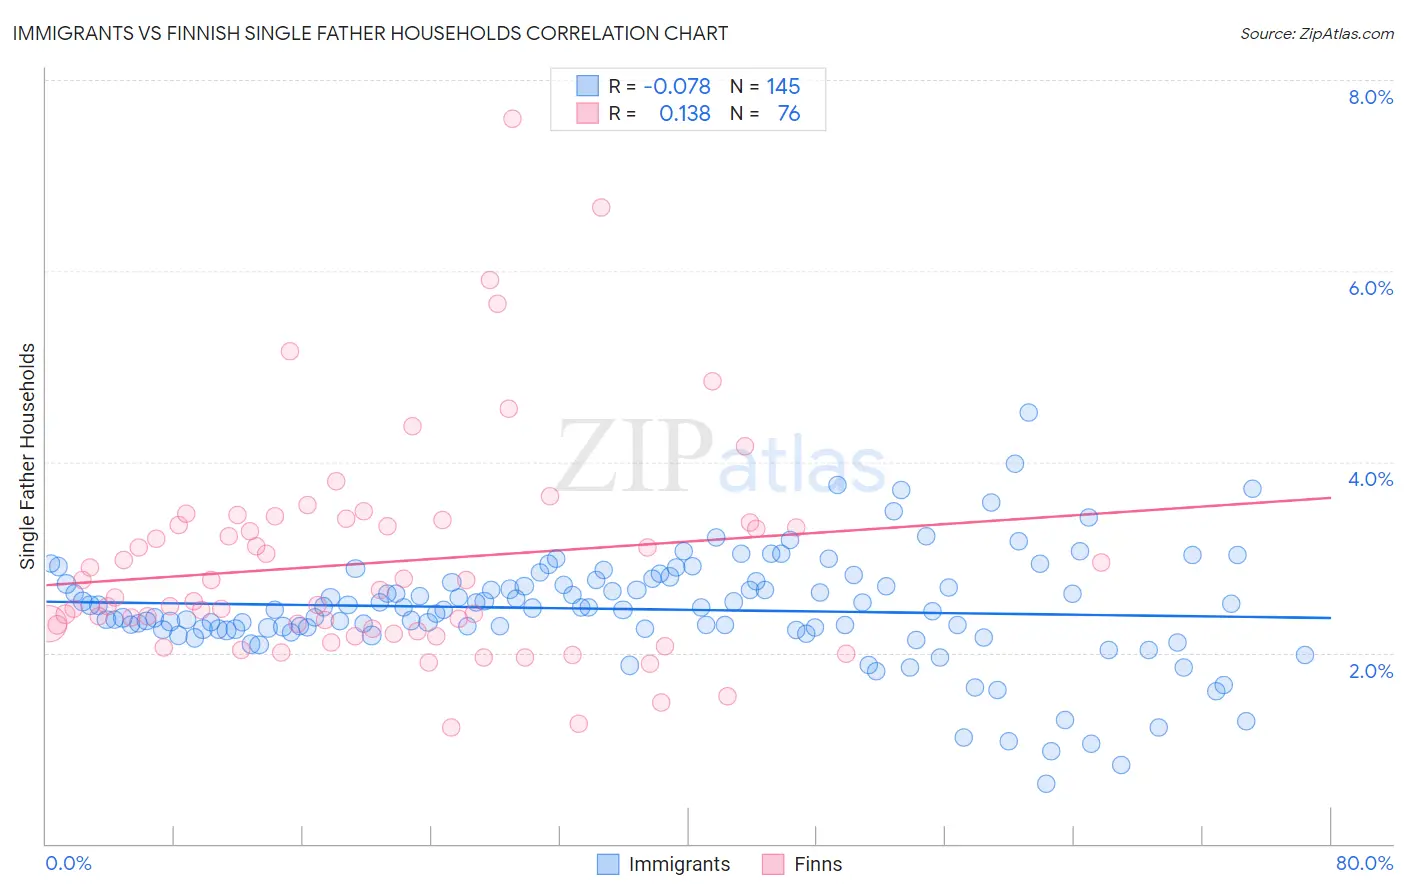
Immigrants vs Finnish Single Father Households Correlation Chart
The statistical analysis conducted on geographies consisting of 561,636,602 people shows a slight negative correlation between the proportion of Immigrants and percentage of single father households in the United States with a correlation coefficient (R) of -0.078 and weighted average of 2.5%. Similarly, the statistical analysis conducted on geographies consisting of 400,074,189 people shows a poor positive correlation between the proportion of Finns and percentage of single father households in the United States with a correlation coefficient (R) of 0.138 and weighted average of 2.4%, a difference of 2.2%.
Single Father Households Correlation Summary
| Measurement | Immigrants | Finnish |
| Minimum | 0.62% | 1.2% |
| Maximum | 4.5% | 7.6% |
| Range | 3.9% | 6.4% |
| Mean | 2.5% | 2.9% |
| Median | 2.5% | 2.6% |
| Interquartile 25% (IQ1) | 2.2% | 2.2% |
| Interquartile 75% (IQ3) | 2.7% | 3.4% |
| Interquartile Range (IQR) | 0.49% | 1.1% |
| Standard Deviation (Sample) | 0.58% | 1.1% |
| Standard Deviation (Population) | 0.58% | 1.1% |
Similar Demographics by Single Father Households
Demographics Similar to Immigrants by Single Father Households
In terms of single father households, the demographic groups most similar to Immigrants are African (2.5%, a difference of 0.020%), Cajun (2.5%, a difference of 0.050%), Sierra Leonean (2.5%, a difference of 0.10%), Immigrants from Sierra Leone (2.5%, a difference of 0.13%), and Immigrants from Oceania (2.5%, a difference of 0.14%).
| Demographics | Rating | Rank | Single Father Households |
| Immigrants | Ghana | 9.1 /100 | #228 | Tragic 2.4% |
| Immigrants | Zaire | 8.6 /100 | #229 | Tragic 2.4% |
| Sub-Saharan Africans | 8.3 /100 | #230 | Tragic 2.4% |
| Immigrants | Nonimmigrants | 7.6 /100 | #231 | Tragic 2.4% |
| Pennsylvania Germans | 7.3 /100 | #232 | Tragic 2.4% |
| Immigrants | Western Africa | 7.0 /100 | #233 | Tragic 2.4% |
| Africans | 6.3 /100 | #234 | Tragic 2.5% |
| Immigrants | Immigrants | 6.3 /100 | #235 | Tragic 2.5% |
| Cajuns | 6.1 /100 | #236 | Tragic 2.5% |
| Sierra Leoneans | 5.9 /100 | #237 | Tragic 2.5% |
| Immigrants | Sierra Leone | 5.8 /100 | #238 | Tragic 2.5% |
| Immigrants | Oceania | 5.8 /100 | #239 | Tragic 2.5% |
| Immigrants | Dominica | 4.8 /100 | #240 | Tragic 2.5% |
| Portuguese | 4.1 /100 | #241 | Tragic 2.5% |
| Osage | 4.1 /100 | #242 | Tragic 2.5% |
Demographics Similar to Finns by Single Father Households
In terms of single father households, the demographic groups most similar to Finns are Immigrants from Nigeria (2.4%, a difference of 0.050%), Immigrants from Costa Rica (2.4%, a difference of 0.10%), Immigrants from Peru (2.4%, a difference of 0.11%), Norwegian (2.4%, a difference of 0.15%), and Ethiopian (2.4%, a difference of 0.21%).
| Demographics | Rating | Rank | Single Father Households |
| Immigrants | Afghanistan | 24.2 /100 | #205 | Fair 2.4% |
| Koreans | 24.1 /100 | #206 | Fair 2.4% |
| Whites/Caucasians | 22.6 /100 | #207 | Fair 2.4% |
| Immigrants | Kenya | 20.3 /100 | #208 | Fair 2.4% |
| Immigrants | Peru | 19.3 /100 | #209 | Poor 2.4% |
| Immigrants | Costa Rica | 19.2 /100 | #210 | Poor 2.4% |
| Immigrants | Nigeria | 18.7 /100 | #211 | Poor 2.4% |
| Finns | 18.3 /100 | #212 | Poor 2.4% |
| Norwegians | 17.1 /100 | #213 | Poor 2.4% |
| Ethiopians | 16.6 /100 | #214 | Poor 2.4% |
| Immigrants | South Eastern Asia | 15.9 /100 | #215 | Poor 2.4% |
| Immigrants | Ecuador | 14.9 /100 | #216 | Poor 2.4% |
| Dutch | 14.3 /100 | #217 | Poor 2.4% |
| Immigrants | Ethiopia | 13.4 /100 | #218 | Poor 2.4% |
| Sudanese | 13.0 /100 | #219 | Poor 2.4% |