Finnish vs Immigrants from Uganda Single Father Households
COMPARE
Finnish
Immigrants from Uganda
Single Father Households
Single Father Households Comparison
Finns
Immigrants from Uganda
2.4%
SINGLE FATHER HOUSEHOLDS
18.3/ 100
METRIC RATING
212th/ 347
METRIC RANK
2.4%
SINGLE FATHER HOUSEHOLDS
26.0/ 100
METRIC RATING
201st/ 347
METRIC RANK
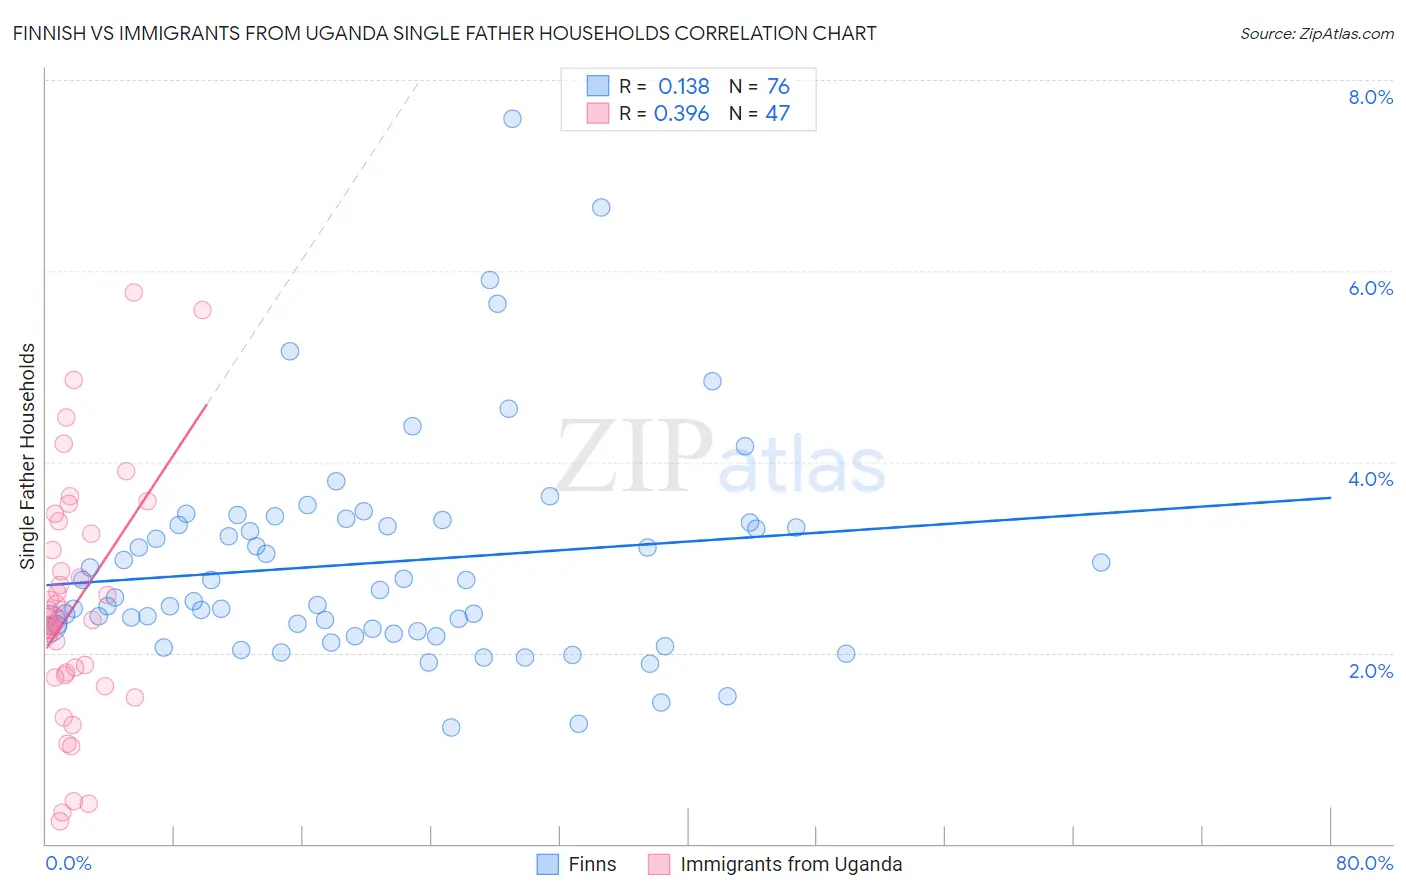
Finnish vs Immigrants from Uganda Single Father Households Correlation Chart
The statistical analysis conducted on geographies consisting of 400,074,189 people shows a poor positive correlation between the proportion of Finns and percentage of single father households in the United States with a correlation coefficient (R) of 0.138 and weighted average of 2.4%. Similarly, the statistical analysis conducted on geographies consisting of 125,685,639 people shows a mild positive correlation between the proportion of Immigrants from Uganda and percentage of single father households in the United States with a correlation coefficient (R) of 0.396 and weighted average of 2.4%, a difference of 0.81%.
Single Father Households Correlation Summary
| Measurement | Finnish | Immigrants from Uganda |
| Minimum | 1.2% | 0.24% |
| Maximum | 7.6% | 5.8% |
| Range | 6.4% | 5.5% |
| Mean | 2.9% | 2.5% |
| Median | 2.6% | 2.4% |
| Interquartile 25% (IQ1) | 2.2% | 1.8% |
| Interquartile 75% (IQ3) | 3.4% | 3.2% |
| Interquartile Range (IQR) | 1.1% | 1.5% |
| Standard Deviation (Sample) | 1.1% | 1.2% |
| Standard Deviation (Population) | 1.1% | 1.2% |
Demographics Similar to Finns and Immigrants from Uganda by Single Father Households
In terms of single father households, the demographic groups most similar to Finns are Immigrants from Nigeria (2.4%, a difference of 0.050%), Immigrants from Costa Rica (2.4%, a difference of 0.10%), Immigrants from Peru (2.4%, a difference of 0.11%), Norwegian (2.4%, a difference of 0.15%), and Ethiopian (2.4%, a difference of 0.21%). Similarly, the demographic groups most similar to Immigrants from Uganda are German Russian (2.4%, a difference of 0.030%), Immigrants from Vietnam (2.4%, a difference of 0.10%), Peruvian (2.4%, a difference of 0.10%), Scandinavian (2.4%, a difference of 0.13%), and French Canadian (2.4%, a difference of 0.13%).
| Demographics | Rating | Rank | Single Father Households |
| Kenyans | 28.0 /100 | #196 | Fair 2.4% |
| Germans | 28.0 /100 | #197 | Fair 2.4% |
| Scandinavians | 27.4 /100 | #198 | Fair 2.4% |
| Immigrants | Vietnam | 27.1 /100 | #199 | Fair 2.4% |
| Peruvians | 27.1 /100 | #200 | Fair 2.4% |
| Immigrants | Uganda | 26.0 /100 | #201 | Fair 2.4% |
| German Russians | 25.7 /100 | #202 | Fair 2.4% |
| French Canadians | 24.7 /100 | #203 | Fair 2.4% |
| Ecuadorians | 24.5 /100 | #204 | Fair 2.4% |
| Immigrants | Afghanistan | 24.2 /100 | #205 | Fair 2.4% |
| Koreans | 24.1 /100 | #206 | Fair 2.4% |
| Whites/Caucasians | 22.6 /100 | #207 | Fair 2.4% |
| Immigrants | Kenya | 20.3 /100 | #208 | Fair 2.4% |
| Immigrants | Peru | 19.3 /100 | #209 | Poor 2.4% |
| Immigrants | Costa Rica | 19.2 /100 | #210 | Poor 2.4% |
| Immigrants | Nigeria | 18.7 /100 | #211 | Poor 2.4% |
| Finns | 18.3 /100 | #212 | Poor 2.4% |
| Norwegians | 17.1 /100 | #213 | Poor 2.4% |
| Ethiopians | 16.6 /100 | #214 | Poor 2.4% |
| Immigrants | South Eastern Asia | 15.9 /100 | #215 | Poor 2.4% |
| Immigrants | Ecuador | 14.9 /100 | #216 | Poor 2.4% |