Immigrants vs Immigrants from Brazil Single Father Households
COMPARE
Immigrants
Immigrants from Brazil
Single Father Households
Single Father Households Comparison
Immigrants
Immigrants from Brazil
2.5%
SINGLE FATHER HOUSEHOLDS
6.3/ 100
METRIC RATING
235th/ 347
METRIC RANK
2.2%
SINGLE FATHER HOUSEHOLDS
97.7/ 100
METRIC RATING
121st/ 347
METRIC RANK
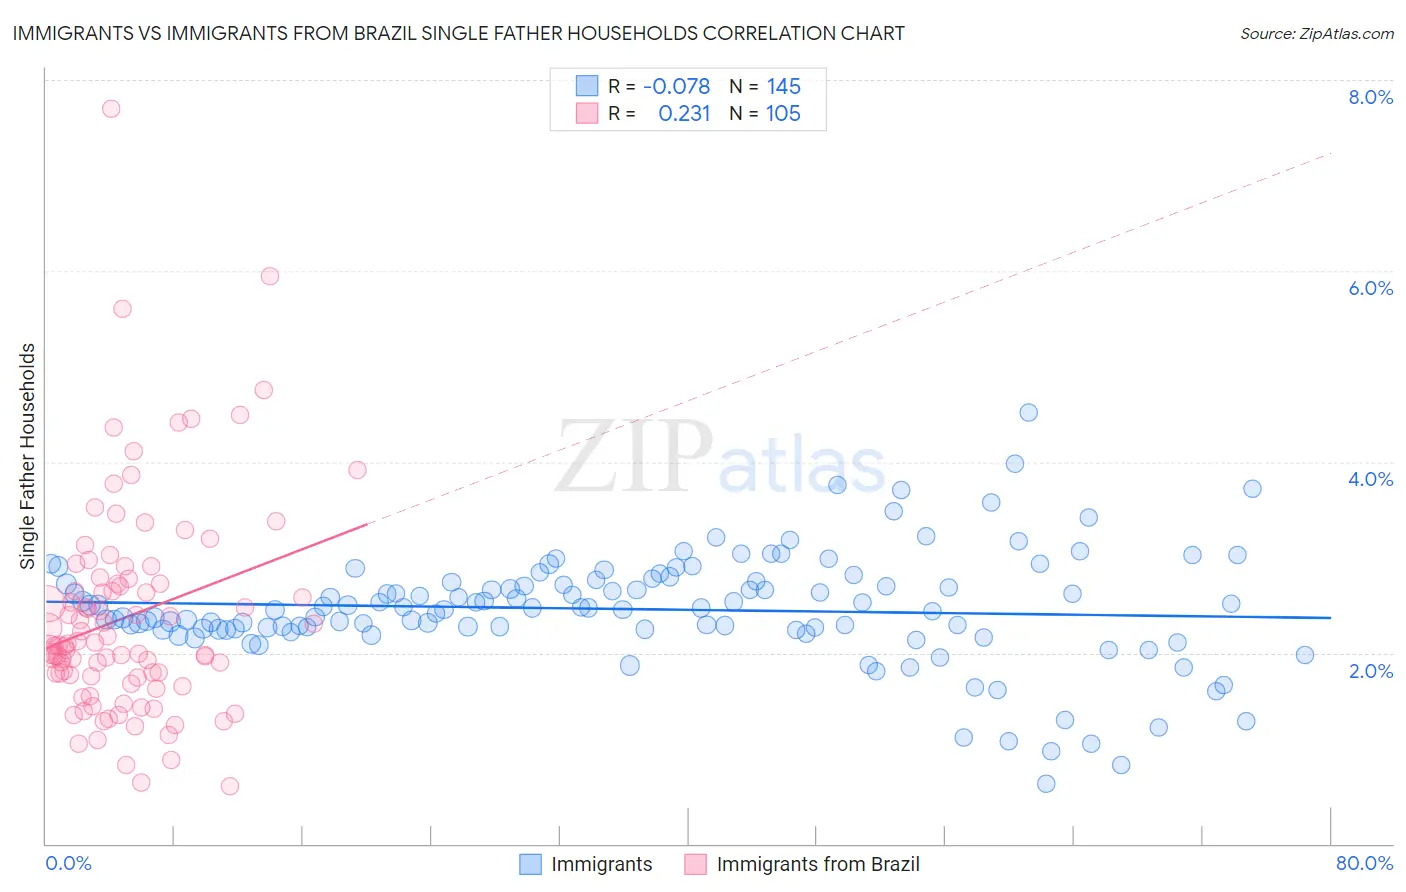
Immigrants vs Immigrants from Brazil Single Father Households Correlation Chart
The statistical analysis conducted on geographies consisting of 561,636,602 people shows a slight negative correlation between the proportion of Immigrants and percentage of single father households in the United States with a correlation coefficient (R) of -0.078 and weighted average of 2.5%. Similarly, the statistical analysis conducted on geographies consisting of 340,503,881 people shows a weak positive correlation between the proportion of Immigrants from Brazil and percentage of single father households in the United States with a correlation coefficient (R) of 0.231 and weighted average of 2.2%, a difference of 12.8%.
Single Father Households Correlation Summary
| Measurement | Immigrants | Immigrants from Brazil |
| Minimum | 0.62% | 0.60% |
| Maximum | 4.5% | 7.7% |
| Range | 3.9% | 7.1% |
| Mean | 2.5% | 2.4% |
| Median | 2.5% | 2.1% |
| Interquartile 25% (IQ1) | 2.2% | 1.7% |
| Interquartile 75% (IQ3) | 2.7% | 2.8% |
| Interquartile Range (IQR) | 0.49% | 1.0% |
| Standard Deviation (Sample) | 0.58% | 1.1% |
| Standard Deviation (Population) | 0.58% | 1.1% |
Similar Demographics by Single Father Households
Demographics Similar to Immigrants by Single Father Households
In terms of single father households, the demographic groups most similar to Immigrants are African (2.5%, a difference of 0.020%), Cajun (2.5%, a difference of 0.050%), Sierra Leonean (2.5%, a difference of 0.10%), Immigrants from Sierra Leone (2.5%, a difference of 0.13%), and Immigrants from Oceania (2.5%, a difference of 0.14%).
| Demographics | Rating | Rank | Single Father Households |
| Immigrants | Ghana | 9.1 /100 | #228 | Tragic 2.4% |
| Immigrants | Zaire | 8.6 /100 | #229 | Tragic 2.4% |
| Sub-Saharan Africans | 8.3 /100 | #230 | Tragic 2.4% |
| Immigrants | Nonimmigrants | 7.6 /100 | #231 | Tragic 2.4% |
| Pennsylvania Germans | 7.3 /100 | #232 | Tragic 2.4% |
| Immigrants | Western Africa | 7.0 /100 | #233 | Tragic 2.4% |
| Africans | 6.3 /100 | #234 | Tragic 2.5% |
| Immigrants | Immigrants | 6.3 /100 | #235 | Tragic 2.5% |
| Cajuns | 6.1 /100 | #236 | Tragic 2.5% |
| Sierra Leoneans | 5.9 /100 | #237 | Tragic 2.5% |
| Immigrants | Sierra Leone | 5.8 /100 | #238 | Tragic 2.5% |
| Immigrants | Oceania | 5.8 /100 | #239 | Tragic 2.5% |
| Immigrants | Dominica | 4.8 /100 | #240 | Tragic 2.5% |
| Portuguese | 4.1 /100 | #241 | Tragic 2.5% |
| Osage | 4.1 /100 | #242 | Tragic 2.5% |
Demographics Similar to Immigrants from Brazil by Single Father Households
In terms of single father households, the demographic groups most similar to Immigrants from Brazil are Australian (2.2%, a difference of 0.0%), Trinidadian and Tobagonian (2.2%, a difference of 0.040%), Immigrants from Morocco (2.2%, a difference of 0.090%), Immigrants from Iraq (2.2%, a difference of 0.10%), and Hungarian (2.2%, a difference of 0.19%).
| Demographics | Rating | Rank | Single Father Households |
| Immigrants | North America | 98.2 /100 | #114 | Exceptional 2.2% |
| Immigrants | Barbados | 98.2 /100 | #115 | Exceptional 2.2% |
| Immigrants | Argentina | 98.1 /100 | #116 | Exceptional 2.2% |
| Hungarians | 97.9 /100 | #117 | Exceptional 2.2% |
| Immigrants | Morocco | 97.8 /100 | #118 | Exceptional 2.2% |
| Trinidadians and Tobagonians | 97.8 /100 | #119 | Exceptional 2.2% |
| Australians | 97.7 /100 | #120 | Exceptional 2.2% |
| Immigrants | Brazil | 97.7 /100 | #121 | Exceptional 2.2% |
| Immigrants | Iraq | 97.6 /100 | #122 | Exceptional 2.2% |
| Immigrants | Yemen | 97.5 /100 | #123 | Exceptional 2.2% |
| British West Indians | 97.4 /100 | #124 | Exceptional 2.2% |
| Immigrants | Indonesia | 97.4 /100 | #125 | Exceptional 2.2% |
| Moroccans | 96.9 /100 | #126 | Exceptional 2.2% |
| Jordanians | 96.9 /100 | #127 | Exceptional 2.2% |
| Immigrants | England | 96.8 /100 | #128 | Exceptional 2.2% |