Immigrants vs Immigrants from South America Single Father Households
COMPARE
Immigrants
Immigrants from South America
Single Father Households
Single Father Households Comparison
Immigrants
Immigrants from South America
2.5%
SINGLE FATHER HOUSEHOLDS
6.3/ 100
METRIC RATING
235th/ 347
METRIC RANK
2.3%
SINGLE FATHER HOUSEHOLDS
79.9/ 100
METRIC RATING
156th/ 347
METRIC RANK
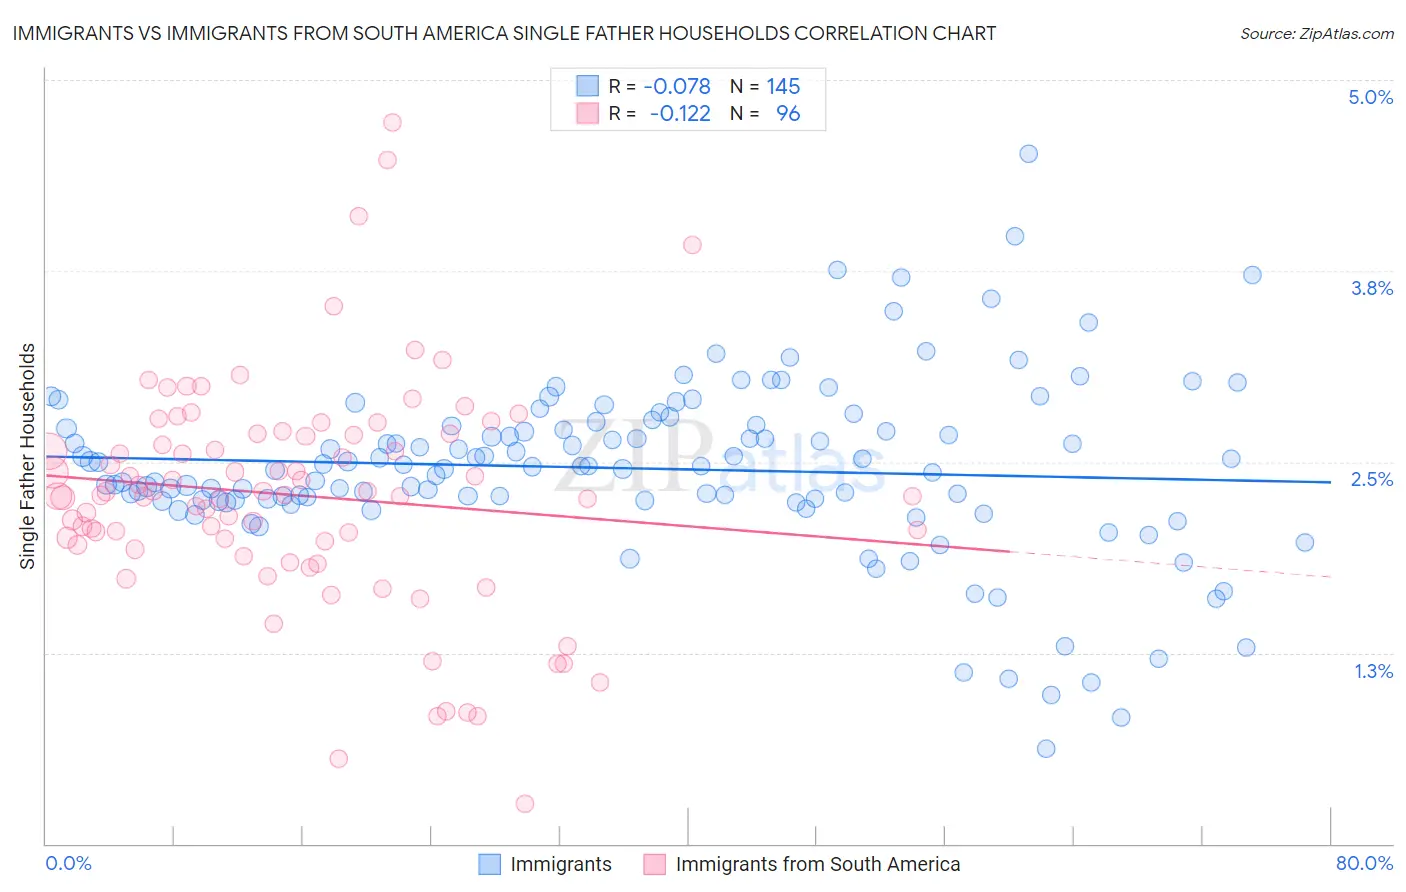
Immigrants vs Immigrants from South America Single Father Households Correlation Chart
The statistical analysis conducted on geographies consisting of 561,636,602 people shows a slight negative correlation between the proportion of Immigrants and percentage of single father households in the United States with a correlation coefficient (R) of -0.078 and weighted average of 2.5%. Similarly, the statistical analysis conducted on geographies consisting of 479,744,076 people shows a poor negative correlation between the proportion of Immigrants from South America and percentage of single father households in the United States with a correlation coefficient (R) of -0.122 and weighted average of 2.3%, a difference of 7.7%.
Single Father Households Correlation Summary
| Measurement | Immigrants | Immigrants from South America |
| Minimum | 0.62% | 0.26% |
| Maximum | 4.5% | 4.7% |
| Range | 3.9% | 4.5% |
| Mean | 2.5% | 2.3% |
| Median | 2.5% | 2.3% |
| Interquartile 25% (IQ1) | 2.2% | 2.0% |
| Interquartile 75% (IQ3) | 2.7% | 2.7% |
| Interquartile Range (IQR) | 0.49% | 0.71% |
| Standard Deviation (Sample) | 0.58% | 0.75% |
| Standard Deviation (Population) | 0.58% | 0.74% |
Similar Demographics by Single Father Households
Demographics Similar to Immigrants by Single Father Households
In terms of single father households, the demographic groups most similar to Immigrants are African (2.5%, a difference of 0.020%), Cajun (2.5%, a difference of 0.050%), Sierra Leonean (2.5%, a difference of 0.10%), Immigrants from Sierra Leone (2.5%, a difference of 0.13%), and Immigrants from Oceania (2.5%, a difference of 0.14%).
| Demographics | Rating | Rank | Single Father Households |
| Immigrants | Ghana | 9.1 /100 | #228 | Tragic 2.4% |
| Immigrants | Zaire | 8.6 /100 | #229 | Tragic 2.4% |
| Sub-Saharan Africans | 8.3 /100 | #230 | Tragic 2.4% |
| Immigrants | Nonimmigrants | 7.6 /100 | #231 | Tragic 2.4% |
| Pennsylvania Germans | 7.3 /100 | #232 | Tragic 2.4% |
| Immigrants | Western Africa | 7.0 /100 | #233 | Tragic 2.4% |
| Africans | 6.3 /100 | #234 | Tragic 2.5% |
| Immigrants | Immigrants | 6.3 /100 | #235 | Tragic 2.5% |
| Cajuns | 6.1 /100 | #236 | Tragic 2.5% |
| Sierra Leoneans | 5.9 /100 | #237 | Tragic 2.5% |
| Immigrants | Sierra Leone | 5.8 /100 | #238 | Tragic 2.5% |
| Immigrants | Oceania | 5.8 /100 | #239 | Tragic 2.5% |
| Immigrants | Dominica | 4.8 /100 | #240 | Tragic 2.5% |
| Portuguese | 4.1 /100 | #241 | Tragic 2.5% |
| Osage | 4.1 /100 | #242 | Tragic 2.5% |
Demographics Similar to Immigrants from South America by Single Father Households
In terms of single father households, the demographic groups most similar to Immigrants from South America are Canadian (2.3%, a difference of 0.020%), Immigrants from Senegal (2.3%, a difference of 0.050%), European (2.3%, a difference of 0.12%), Bolivian (2.3%, a difference of 0.14%), and Immigrants from West Indies (2.3%, a difference of 0.22%).
| Demographics | Rating | Rank | Single Father Households |
| Senegalese | 88.4 /100 | #149 | Excellent 2.3% |
| Venezuelans | 86.2 /100 | #150 | Excellent 2.3% |
| Immigrants | Syria | 84.8 /100 | #151 | Excellent 2.3% |
| Immigrants | Venezuela | 83.2 /100 | #152 | Excellent 2.3% |
| Immigrants | Germany | 82.8 /100 | #153 | Excellent 2.3% |
| Bolivians | 81.0 /100 | #154 | Excellent 2.3% |
| Europeans | 80.9 /100 | #155 | Excellent 2.3% |
| Immigrants | South America | 79.9 /100 | #156 | Good 2.3% |
| Canadians | 79.7 /100 | #157 | Good 2.3% |
| Immigrants | Senegal | 79.4 /100 | #158 | Good 2.3% |
| Immigrants | West Indies | 77.9 /100 | #159 | Good 2.3% |
| Immigrants | Bolivia | 76.3 /100 | #160 | Good 2.3% |
| Swiss | 73.2 /100 | #161 | Good 2.3% |
| Scottish | 72.8 /100 | #162 | Good 2.3% |
| Irish | 72.1 /100 | #163 | Good 2.3% |