Swiss vs Fijian Single Father Households
COMPARE
Swiss
Fijian
Single Father Households
Single Father Households Comparison
Swiss
Fijians
2.3%
SINGLE FATHER HOUSEHOLDS
73.2/ 100
METRIC RATING
161st/ 347
METRIC RANK
3.0%
SINGLE FATHER HOUSEHOLDS
0.0/ 100
METRIC RATING
324th/ 347
METRIC RANK
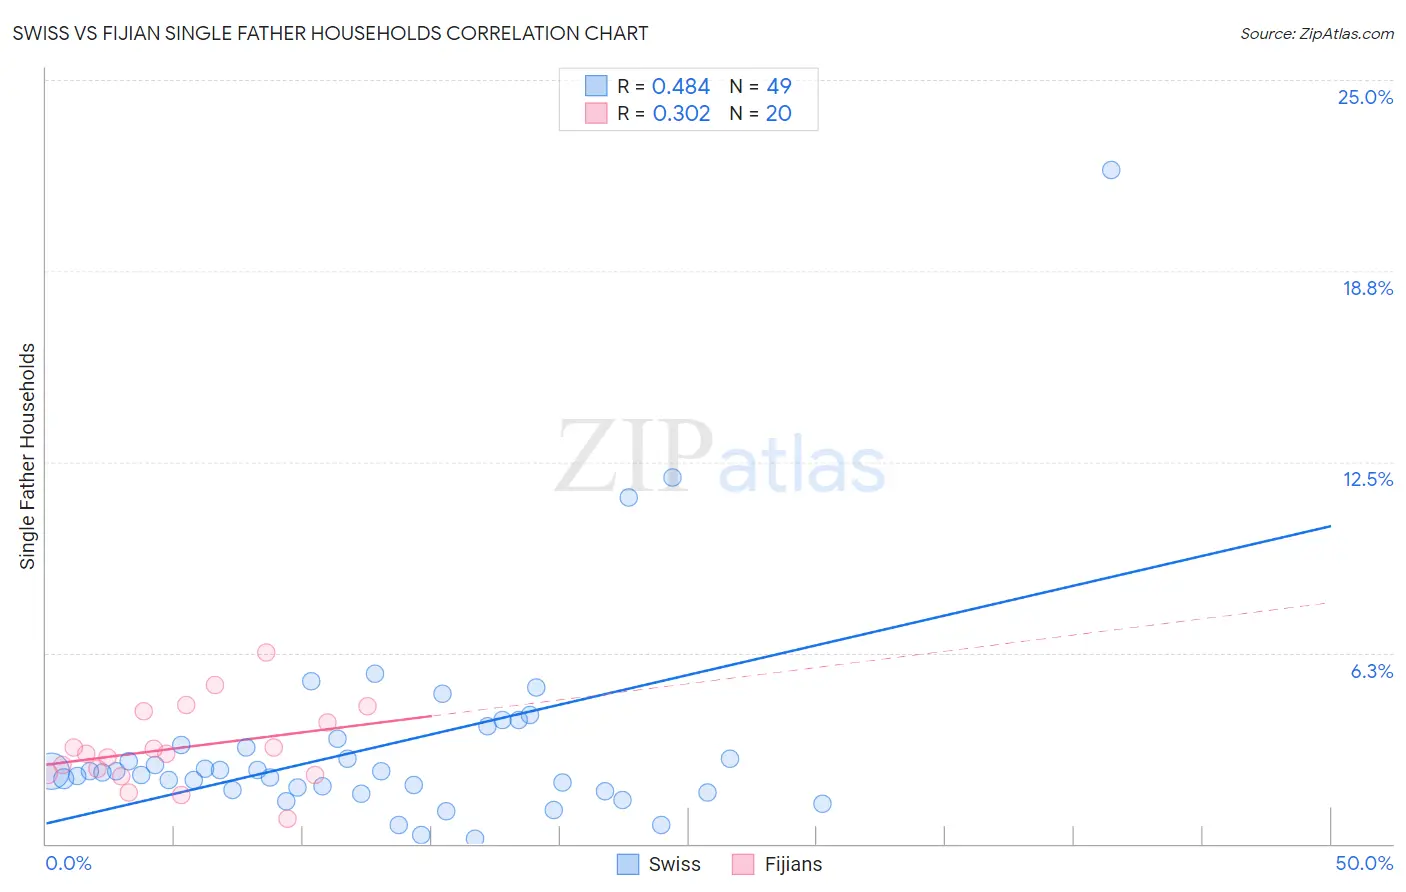
Swiss vs Fijian Single Father Households Correlation Chart
The statistical analysis conducted on geographies consisting of 458,392,484 people shows a moderate positive correlation between the proportion of Swiss and percentage of single father households in the United States with a correlation coefficient (R) of 0.484 and weighted average of 2.3%. Similarly, the statistical analysis conducted on geographies consisting of 55,868,247 people shows a mild positive correlation between the proportion of Fijians and percentage of single father households in the United States with a correlation coefficient (R) of 0.302 and weighted average of 3.0%, a difference of 30.9%.
Single Father Households Correlation Summary
| Measurement | Swiss | Fijian |
| Minimum | 0.16% | 0.84% |
| Maximum | 22.1% | 6.3% |
| Range | 21.9% | 5.4% |
| Mean | 3.2% | 3.1% |
| Median | 2.4% | 3.0% |
| Interquartile 25% (IQ1) | 1.7% | 2.3% |
| Interquartile 75% (IQ3) | 3.3% | 4.1% |
| Interquartile Range (IQR) | 1.6% | 1.9% |
| Standard Deviation (Sample) | 3.5% | 1.3% |
| Standard Deviation (Population) | 3.5% | 1.3% |
Similar Demographics by Single Father Households
Demographics Similar to Swiss by Single Father Households
In terms of single father households, the demographic groups most similar to Swiss are Scottish (2.3%, a difference of 0.030%), Irish (2.3%, a difference of 0.11%), Pakistani (2.3%, a difference of 0.25%), Immigrants from Bolivia (2.3%, a difference of 0.30%), and Scotch-Irish (2.3%, a difference of 0.35%).
| Demographics | Rating | Rank | Single Father Households |
| Bolivians | 81.0 /100 | #154 | Excellent 2.3% |
| Europeans | 80.9 /100 | #155 | Excellent 2.3% |
| Immigrants | South America | 79.9 /100 | #156 | Good 2.3% |
| Canadians | 79.7 /100 | #157 | Good 2.3% |
| Immigrants | Senegal | 79.4 /100 | #158 | Good 2.3% |
| Immigrants | West Indies | 77.9 /100 | #159 | Good 2.3% |
| Immigrants | Bolivia | 76.3 /100 | #160 | Good 2.3% |
| Swiss | 73.2 /100 | #161 | Good 2.3% |
| Scottish | 72.8 /100 | #162 | Good 2.3% |
| Irish | 72.1 /100 | #163 | Good 2.3% |
| Pakistanis | 70.6 /100 | #164 | Good 2.3% |
| Scotch-Irish | 69.4 /100 | #165 | Good 2.3% |
| English | 68.6 /100 | #166 | Good 2.3% |
| South Americans | 64.3 /100 | #167 | Good 2.3% |
| Icelanders | 63.1 /100 | #168 | Good 2.3% |
Demographics Similar to Fijians by Single Father Households
In terms of single father households, the demographic groups most similar to Fijians are Immigrants from Central America (3.0%, a difference of 0.080%), Immigrants from Guatemala (3.0%, a difference of 0.39%), Mexican (3.0%, a difference of 0.92%), Immigrants from Mexico (3.0%, a difference of 1.2%), and Guatemalan (3.0%, a difference of 1.3%).
| Demographics | Rating | Rank | Single Father Households |
| Immigrants | El Salvador | 0.0 /100 | #317 | Tragic 2.9% |
| Cape Verdeans | 0.0 /100 | #318 | Tragic 2.9% |
| Ute | 0.0 /100 | #319 | Tragic 3.0% |
| Guatemalans | 0.0 /100 | #320 | Tragic 3.0% |
| Mexicans | 0.0 /100 | #321 | Tragic 3.0% |
| Immigrants | Guatemala | 0.0 /100 | #322 | Tragic 3.0% |
| Immigrants | Central America | 0.0 /100 | #323 | Tragic 3.0% |
| Fijians | 0.0 /100 | #324 | Tragic 3.0% |
| Immigrants | Mexico | 0.0 /100 | #325 | Tragic 3.0% |
| Aleuts | 0.0 /100 | #326 | Tragic 3.0% |
| Bangladeshis | 0.0 /100 | #327 | Tragic 3.1% |
| Immigrants | Cabo Verde | 0.0 /100 | #328 | Tragic 3.1% |
| Chippewa | 0.0 /100 | #329 | Tragic 3.1% |
| Nepalese | 0.0 /100 | #330 | Tragic 3.1% |
| Navajo | 0.0 /100 | #331 | Tragic 3.2% |