Immigrants from Bangladesh vs Fijian Single Father Households
COMPARE
Immigrants from Bangladesh
Fijian
Single Father Households
Single Father Households Comparison
Immigrants from Bangladesh
Fijians
2.1%
SINGLE FATHER HOUSEHOLDS
99.8/ 100
METRIC RATING
73rd/ 347
METRIC RANK
3.0%
SINGLE FATHER HOUSEHOLDS
0.0/ 100
METRIC RATING
324th/ 347
METRIC RANK
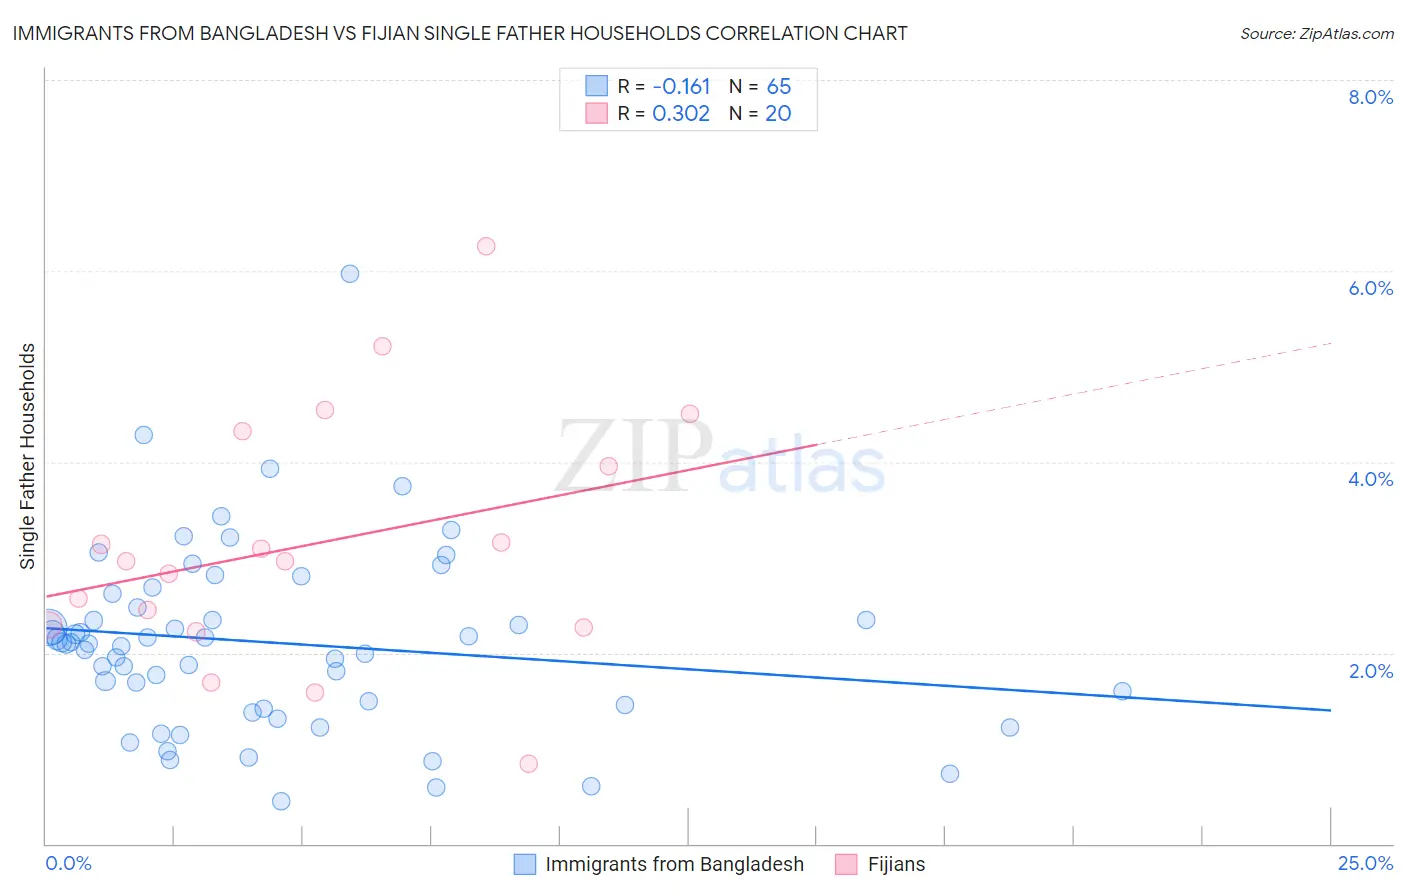
Immigrants from Bangladesh vs Fijian Single Father Households Correlation Chart
The statistical analysis conducted on geographies consisting of 202,870,334 people shows a poor negative correlation between the proportion of Immigrants from Bangladesh and percentage of single father households in the United States with a correlation coefficient (R) of -0.161 and weighted average of 2.1%. Similarly, the statistical analysis conducted on geographies consisting of 55,868,247 people shows a mild positive correlation between the proportion of Fijians and percentage of single father households in the United States with a correlation coefficient (R) of 0.302 and weighted average of 3.0%, a difference of 45.0%.
Single Father Households Correlation Summary
| Measurement | Immigrants from Bangladesh | Fijian |
| Minimum | 0.44% | 0.84% |
| Maximum | 6.0% | 6.3% |
| Range | 5.5% | 5.4% |
| Mean | 2.1% | 3.1% |
| Median | 2.1% | 3.0% |
| Interquartile 25% (IQ1) | 1.4% | 2.3% |
| Interquartile 75% (IQ3) | 2.5% | 4.1% |
| Interquartile Range (IQR) | 1.1% | 1.9% |
| Standard Deviation (Sample) | 0.96% | 1.3% |
| Standard Deviation (Population) | 0.96% | 1.3% |
Similar Demographics by Single Father Households
Demographics Similar to Immigrants from Bangladesh by Single Father Households
In terms of single father households, the demographic groups most similar to Immigrants from Bangladesh are Immigrants from Egypt (2.1%, a difference of 0.0%), Immigrants from Spain (2.1%, a difference of 0.14%), Immigrants from Kuwait (2.1%, a difference of 0.15%), Egyptian (2.1%, a difference of 0.16%), and Immigrants from Sweden (2.1%, a difference of 0.29%).
| Demographics | Rating | Rank | Single Father Households |
| Immigrants | Western Asia | 99.8 /100 | #66 | Exceptional 2.1% |
| Immigrants | Italy | 99.8 /100 | #67 | Exceptional 2.1% |
| Immigrants | Denmark | 99.8 /100 | #68 | Exceptional 2.1% |
| Immigrants | Romania | 99.8 /100 | #69 | Exceptional 2.1% |
| Egyptians | 99.8 /100 | #70 | Exceptional 2.1% |
| Immigrants | Kuwait | 99.8 /100 | #71 | Exceptional 2.1% |
| Immigrants | Spain | 99.8 /100 | #72 | Exceptional 2.1% |
| Immigrants | Bangladesh | 99.8 /100 | #73 | Exceptional 2.1% |
| Immigrants | Egypt | 99.8 /100 | #74 | Exceptional 2.1% |
| Immigrants | Sweden | 99.8 /100 | #75 | Exceptional 2.1% |
| Immigrants | Scotland | 99.8 /100 | #76 | Exceptional 2.1% |
| Immigrants | Saudi Arabia | 99.8 /100 | #77 | Exceptional 2.1% |
| Estonians | 99.7 /100 | #78 | Exceptional 2.1% |
| Immigrants | Asia | 99.7 /100 | #79 | Exceptional 2.1% |
| Immigrants | South Africa | 99.7 /100 | #80 | Exceptional 2.1% |
Demographics Similar to Fijians by Single Father Households
In terms of single father households, the demographic groups most similar to Fijians are Immigrants from Central America (3.0%, a difference of 0.080%), Immigrants from Guatemala (3.0%, a difference of 0.39%), Mexican (3.0%, a difference of 0.92%), Immigrants from Mexico (3.0%, a difference of 1.2%), and Guatemalan (3.0%, a difference of 1.3%).
| Demographics | Rating | Rank | Single Father Households |
| Immigrants | El Salvador | 0.0 /100 | #317 | Tragic 2.9% |
| Cape Verdeans | 0.0 /100 | #318 | Tragic 2.9% |
| Ute | 0.0 /100 | #319 | Tragic 3.0% |
| Guatemalans | 0.0 /100 | #320 | Tragic 3.0% |
| Mexicans | 0.0 /100 | #321 | Tragic 3.0% |
| Immigrants | Guatemala | 0.0 /100 | #322 | Tragic 3.0% |
| Immigrants | Central America | 0.0 /100 | #323 | Tragic 3.0% |
| Fijians | 0.0 /100 | #324 | Tragic 3.0% |
| Immigrants | Mexico | 0.0 /100 | #325 | Tragic 3.0% |
| Aleuts | 0.0 /100 | #326 | Tragic 3.0% |
| Bangladeshis | 0.0 /100 | #327 | Tragic 3.1% |
| Immigrants | Cabo Verde | 0.0 /100 | #328 | Tragic 3.1% |
| Chippewa | 0.0 /100 | #329 | Tragic 3.1% |
| Nepalese | 0.0 /100 | #330 | Tragic 3.1% |
| Navajo | 0.0 /100 | #331 | Tragic 3.2% |