Immigrants from Zaire vs Cajun Births to Unmarried Women
COMPARE
Immigrants from Zaire
Cajun
Births to Unmarried Women
Births to Unmarried Women Comparison
Immigrants from Zaire
Cajuns
34.5%
BIRTHS TO UNMARRIED WOMEN
2.3/ 100
METRIC RATING
234th/ 347
METRIC RANK
41.0%
BIRTHS TO UNMARRIED WOMEN
0.0/ 100
METRIC RATING
322nd/ 347
METRIC RANK
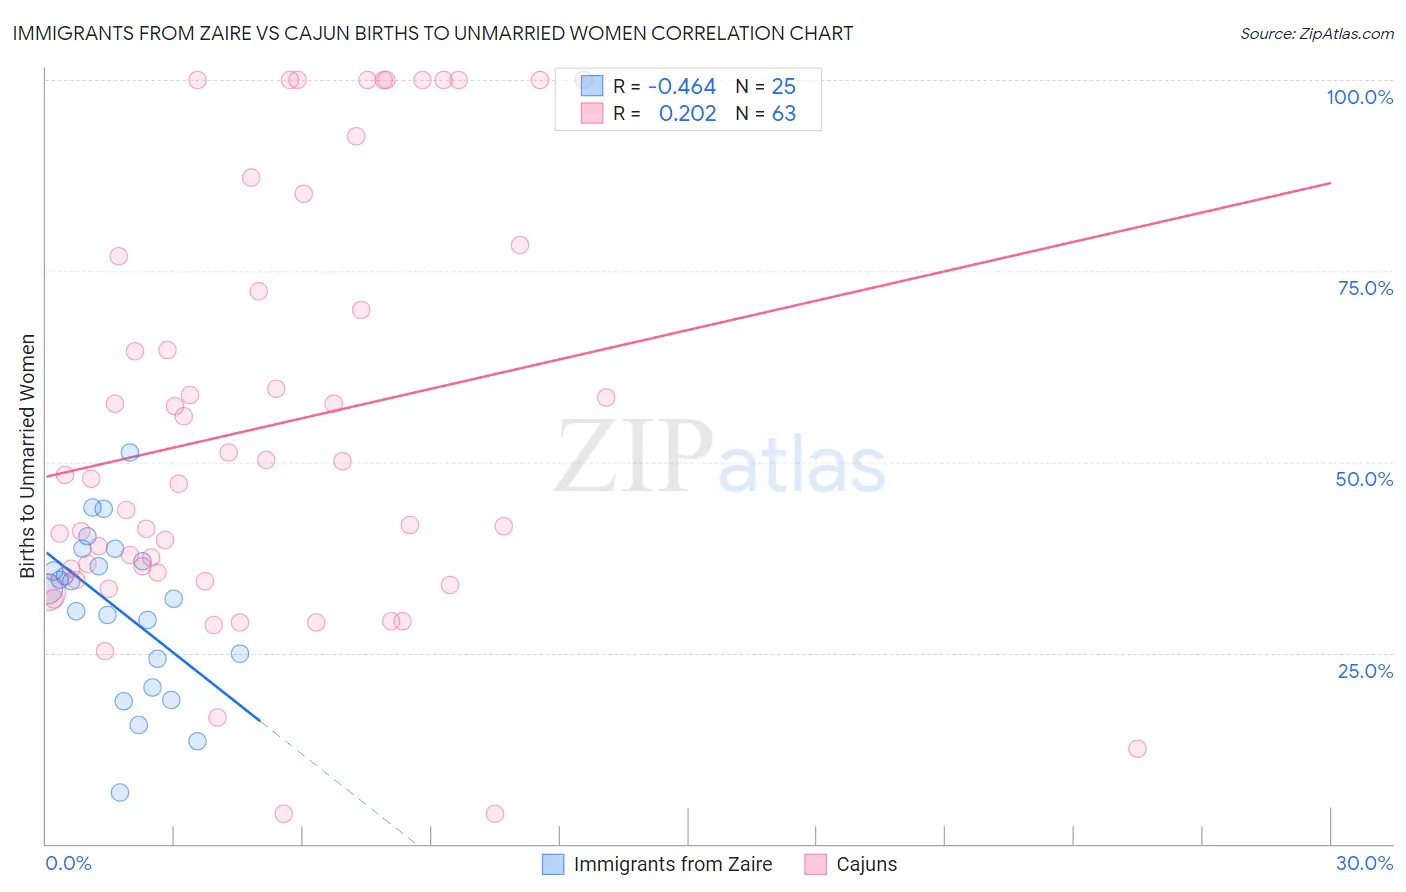
Immigrants from Zaire vs Cajun Births to Unmarried Women Correlation Chart
The statistical analysis conducted on geographies consisting of 105,430,695 people shows a moderate negative correlation between the proportion of Immigrants from Zaire and percentage of births to unmarried women in the United States with a correlation coefficient (R) of -0.464 and weighted average of 34.5%. Similarly, the statistical analysis conducted on geographies consisting of 144,039,196 people shows a weak positive correlation between the proportion of Cajuns and percentage of births to unmarried women in the United States with a correlation coefficient (R) of 0.202 and weighted average of 41.0%, a difference of 18.8%.
Births to Unmarried Women Correlation Summary
| Measurement | Immigrants from Zaire | Cajun |
| Minimum | 6.8% | 4.0% |
| Maximum | 51.2% | 100.0% |
| Range | 44.5% | 96.0% |
| Mean | 30.7% | 54.7% |
| Median | 33.4% | 47.8% |
| Interquartile 25% (IQ1) | 22.4% | 34.6% |
| Interquartile 75% (IQ3) | 37.8% | 76.9% |
| Interquartile Range (IQR) | 15.4% | 42.3% |
| Standard Deviation (Sample) | 10.6% | 27.5% |
| Standard Deviation (Population) | 10.4% | 27.2% |
Similar Demographics by Births to Unmarried Women
Demographics Similar to Immigrants from Zaire by Births to Unmarried Women
In terms of births to unmarried women, the demographic groups most similar to Immigrants from Zaire are Immigrants from Ghana (34.5%, a difference of 0.070%), Bangladeshi (34.4%, a difference of 0.24%), French Canadian (34.4%, a difference of 0.26%), Native Hawaiian (34.3%, a difference of 0.56%), and Ghanaian (34.3%, a difference of 0.70%).
| Demographics | Rating | Rank | Births to Unmarried Women |
| Immigrants | Panama | 3.3 /100 | #227 | Tragic 34.2% |
| Panamanians | 3.3 /100 | #228 | Tragic 34.2% |
| Immigrants | Sierra Leone | 3.1 /100 | #229 | Tragic 34.2% |
| Ghanaians | 3.1 /100 | #230 | Tragic 34.3% |
| Native Hawaiians | 2.9 /100 | #231 | Tragic 34.3% |
| French Canadians | 2.5 /100 | #232 | Tragic 34.4% |
| Bangladeshis | 2.5 /100 | #233 | Tragic 34.4% |
| Immigrants | Zaire | 2.3 /100 | #234 | Tragic 34.5% |
| Immigrants | Ghana | 2.2 /100 | #235 | Tragic 34.5% |
| Immigrants | Cameroon | 1.6 /100 | #236 | Tragic 34.7% |
| Marshallese | 1.6 /100 | #237 | Tragic 34.8% |
| Immigrants | Cambodia | 1.6 /100 | #238 | Tragic 34.8% |
| Sierra Leoneans | 1.4 /100 | #239 | Tragic 34.9% |
| Immigrants | Middle Africa | 1.2 /100 | #240 | Tragic 34.9% |
| Immigrants | Guyana | 1.2 /100 | #241 | Tragic 35.0% |
Demographics Similar to Cajuns by Births to Unmarried Women
In terms of births to unmarried women, the demographic groups most similar to Cajuns are Sioux (41.0%, a difference of 0.070%), Bahamian (40.8%, a difference of 0.49%), Cape Verdean (41.3%, a difference of 0.87%), Cheyenne (41.3%, a difference of 0.93%), and Immigrants from Cuba (41.5%, a difference of 1.2%).
| Demographics | Rating | Rank | Births to Unmarried Women |
| Dominicans | 0.0 /100 | #315 | Tragic 39.8% |
| Apache | 0.0 /100 | #316 | Tragic 39.9% |
| Immigrants | Dominican Republic | 0.0 /100 | #317 | Tragic 40.1% |
| Immigrants | Bahamas | 0.0 /100 | #318 | Tragic 40.1% |
| Yakama | 0.0 /100 | #319 | Tragic 40.3% |
| Crow | 0.0 /100 | #320 | Tragic 40.4% |
| Bahamians | 0.0 /100 | #321 | Tragic 40.8% |
| Cajuns | 0.0 /100 | #322 | Tragic 41.0% |
| Sioux | 0.0 /100 | #323 | Tragic 41.0% |
| Cape Verdeans | 0.0 /100 | #324 | Tragic 41.3% |
| Cheyenne | 0.0 /100 | #325 | Tragic 41.3% |
| Immigrants | Cuba | 0.0 /100 | #326 | Tragic 41.5% |
| Tsimshian | 0.0 /100 | #327 | Tragic 42.2% |
| Immigrants | Cabo Verde | 0.0 /100 | #328 | Tragic 42.2% |
| Paiute | 0.0 /100 | #329 | Tragic 42.5% |