Immigrants from Zaire vs Ethiopian Births to Unmarried Women
COMPARE
Immigrants from Zaire
Ethiopian
Births to Unmarried Women
Births to Unmarried Women Comparison
Immigrants from Zaire
Ethiopians
34.5%
BIRTHS TO UNMARRIED WOMEN
2.3/ 100
METRIC RATING
234th/ 347
METRIC RANK
29.8%
BIRTHS TO UNMARRIED WOMEN
91.9/ 100
METRIC RATING
115th/ 347
METRIC RANK
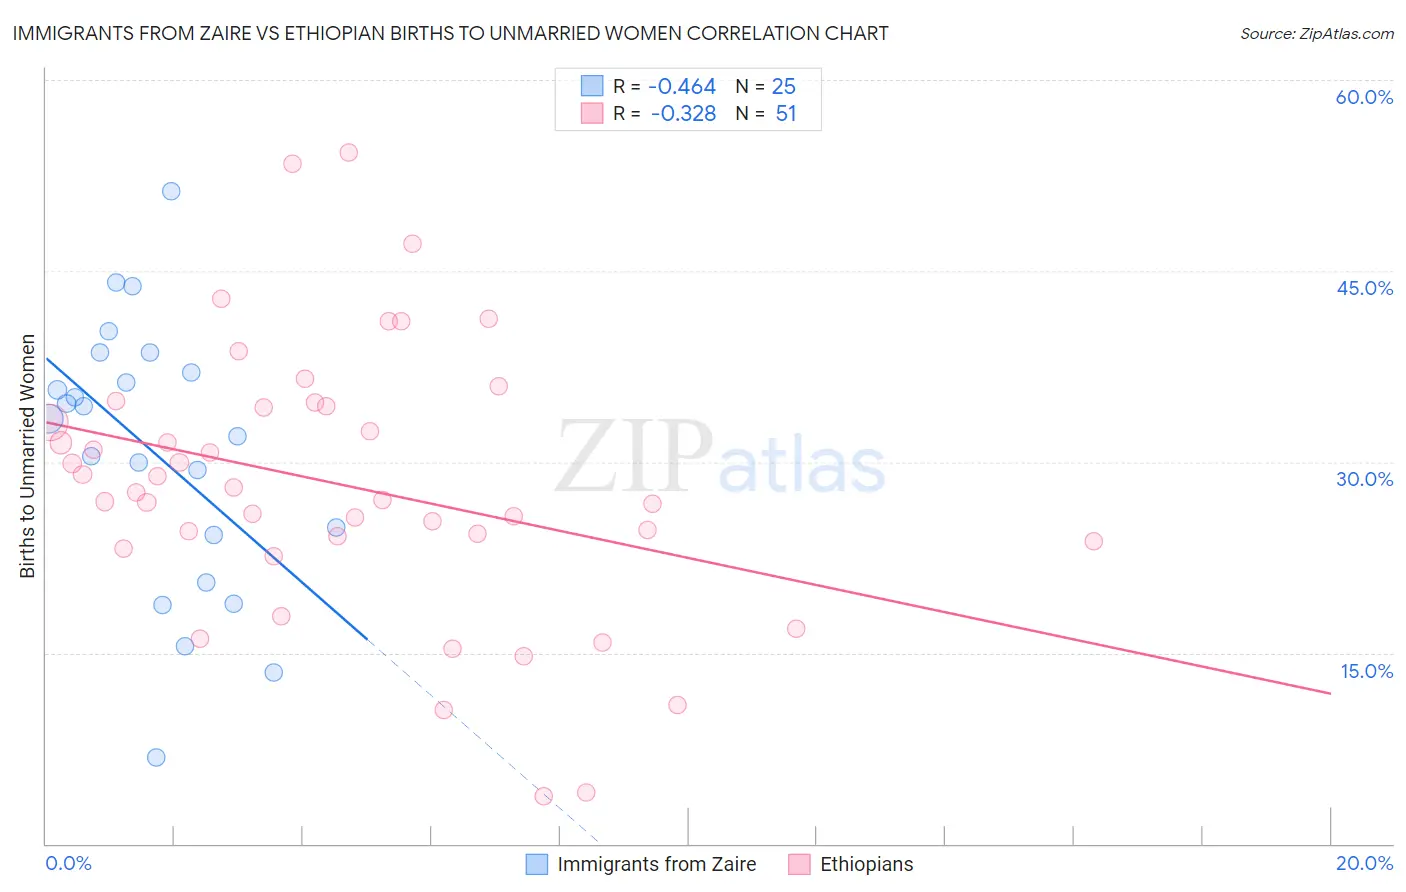
Immigrants from Zaire vs Ethiopian Births to Unmarried Women Correlation Chart
The statistical analysis conducted on geographies consisting of 105,430,695 people shows a moderate negative correlation between the proportion of Immigrants from Zaire and percentage of births to unmarried women in the United States with a correlation coefficient (R) of -0.464 and weighted average of 34.5%. Similarly, the statistical analysis conducted on geographies consisting of 215,740,529 people shows a mild negative correlation between the proportion of Ethiopians and percentage of births to unmarried women in the United States with a correlation coefficient (R) of -0.328 and weighted average of 29.8%, a difference of 15.5%.
Births to Unmarried Women Correlation Summary
| Measurement | Immigrants from Zaire | Ethiopian |
| Minimum | 6.8% | 3.7% |
| Maximum | 51.2% | 54.3% |
| Range | 44.5% | 50.6% |
| Mean | 30.7% | 28.2% |
| Median | 33.4% | 27.6% |
| Interquartile 25% (IQ1) | 22.4% | 23.8% |
| Interquartile 75% (IQ3) | 37.8% | 34.4% |
| Interquartile Range (IQR) | 15.4% | 10.6% |
| Standard Deviation (Sample) | 10.6% | 10.7% |
| Standard Deviation (Population) | 10.4% | 10.6% |
Similar Demographics by Births to Unmarried Women
Demographics Similar to Immigrants from Zaire by Births to Unmarried Women
In terms of births to unmarried women, the demographic groups most similar to Immigrants from Zaire are Immigrants from Ghana (34.5%, a difference of 0.070%), Bangladeshi (34.4%, a difference of 0.24%), French Canadian (34.4%, a difference of 0.26%), Native Hawaiian (34.3%, a difference of 0.56%), and Ghanaian (34.3%, a difference of 0.70%).
| Demographics | Rating | Rank | Births to Unmarried Women |
| Immigrants | Panama | 3.3 /100 | #227 | Tragic 34.2% |
| Panamanians | 3.3 /100 | #228 | Tragic 34.2% |
| Immigrants | Sierra Leone | 3.1 /100 | #229 | Tragic 34.2% |
| Ghanaians | 3.1 /100 | #230 | Tragic 34.3% |
| Native Hawaiians | 2.9 /100 | #231 | Tragic 34.3% |
| French Canadians | 2.5 /100 | #232 | Tragic 34.4% |
| Bangladeshis | 2.5 /100 | #233 | Tragic 34.4% |
| Immigrants | Zaire | 2.3 /100 | #234 | Tragic 34.5% |
| Immigrants | Ghana | 2.2 /100 | #235 | Tragic 34.5% |
| Immigrants | Cameroon | 1.6 /100 | #236 | Tragic 34.7% |
| Marshallese | 1.6 /100 | #237 | Tragic 34.8% |
| Immigrants | Cambodia | 1.6 /100 | #238 | Tragic 34.8% |
| Sierra Leoneans | 1.4 /100 | #239 | Tragic 34.9% |
| Immigrants | Middle Africa | 1.2 /100 | #240 | Tragic 34.9% |
| Immigrants | Guyana | 1.2 /100 | #241 | Tragic 35.0% |
Demographics Similar to Ethiopians by Births to Unmarried Women
In terms of births to unmarried women, the demographic groups most similar to Ethiopians are Immigrants from Italy (29.9%, a difference of 0.080%), Immigrants from Croatia (29.8%, a difference of 0.22%), Scandinavian (29.8%, a difference of 0.28%), Immigrants from Netherlands (29.9%, a difference of 0.29%), and Immigrants from Norway (29.9%, a difference of 0.31%).
| Demographics | Rating | Rank | Births to Unmarried Women |
| Paraguayans | 93.5 /100 | #108 | Exceptional 29.7% |
| Greeks | 93.4 /100 | #109 | Exceptional 29.7% |
| Immigrants | Ethiopia | 93.4 /100 | #110 | Exceptional 29.7% |
| Immigrants | Hungary | 93.0 /100 | #111 | Exceptional 29.7% |
| Basques | 93.0 /100 | #112 | Exceptional 29.7% |
| Scandinavians | 92.7 /100 | #113 | Exceptional 29.8% |
| Immigrants | Croatia | 92.6 /100 | #114 | Exceptional 29.8% |
| Ethiopians | 91.9 /100 | #115 | Exceptional 29.8% |
| Immigrants | Italy | 91.7 /100 | #116 | Exceptional 29.9% |
| Immigrants | Netherlands | 91.1 /100 | #117 | Exceptional 29.9% |
| Immigrants | Norway | 91.0 /100 | #118 | Exceptional 29.9% |
| Argentineans | 90.5 /100 | #119 | Exceptional 30.0% |
| Ugandans | 89.2 /100 | #120 | Excellent 30.1% |
| Koreans | 88.9 /100 | #121 | Excellent 30.1% |
| Immigrants | Argentina | 88.7 /100 | #122 | Excellent 30.1% |