Immigrants from Zaire vs Creek Births to Unmarried Women
COMPARE
Immigrants from Zaire
Creek
Births to Unmarried Women
Births to Unmarried Women Comparison
Immigrants from Zaire
Creek
34.5%
BIRTHS TO UNMARRIED WOMEN
2.3/ 100
METRIC RATING
234th/ 347
METRIC RANK
37.6%
BIRTHS TO UNMARRIED WOMEN
0.0/ 100
METRIC RATING
287th/ 347
METRIC RANK
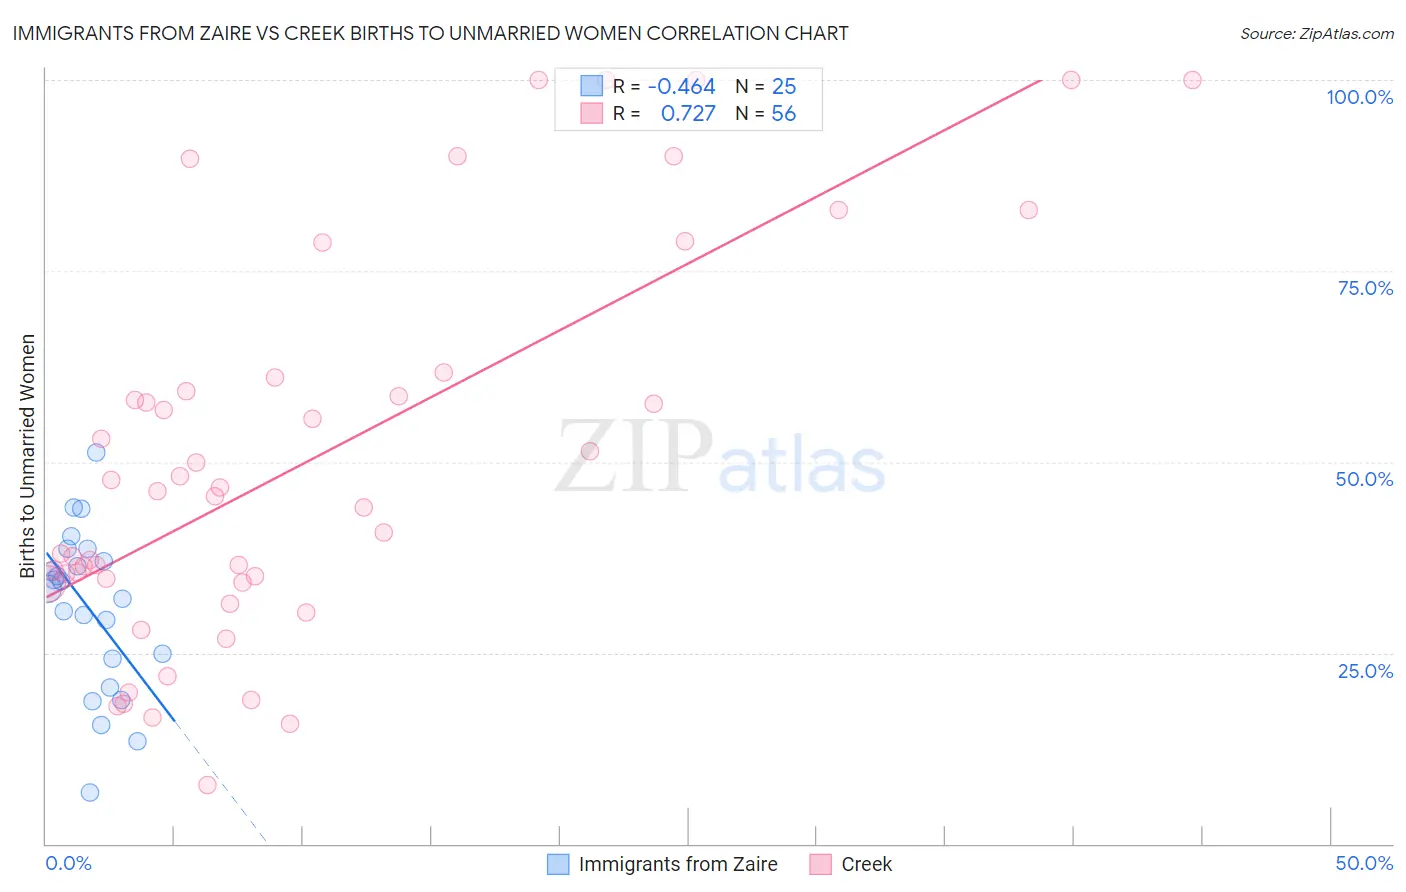
Immigrants from Zaire vs Creek Births to Unmarried Women Correlation Chart
The statistical analysis conducted on geographies consisting of 105,430,695 people shows a moderate negative correlation between the proportion of Immigrants from Zaire and percentage of births to unmarried women in the United States with a correlation coefficient (R) of -0.464 and weighted average of 34.5%. Similarly, the statistical analysis conducted on geographies consisting of 173,524,470 people shows a strong positive correlation between the proportion of Creek and percentage of births to unmarried women in the United States with a correlation coefficient (R) of 0.727 and weighted average of 37.6%, a difference of 8.9%.
Births to Unmarried Women Correlation Summary
| Measurement | Immigrants from Zaire | Creek |
| Minimum | 6.8% | 7.7% |
| Maximum | 51.2% | 100.0% |
| Range | 44.5% | 92.3% |
| Mean | 30.7% | 50.2% |
| Median | 33.4% | 45.8% |
| Interquartile 25% (IQ1) | 22.4% | 34.5% |
| Interquartile 75% (IQ3) | 37.8% | 60.2% |
| Interquartile Range (IQR) | 15.4% | 25.7% |
| Standard Deviation (Sample) | 10.6% | 25.3% |
| Standard Deviation (Population) | 10.4% | 25.0% |
Similar Demographics by Births to Unmarried Women
Demographics Similar to Immigrants from Zaire by Births to Unmarried Women
In terms of births to unmarried women, the demographic groups most similar to Immigrants from Zaire are Immigrants from Ghana (34.5%, a difference of 0.070%), Bangladeshi (34.4%, a difference of 0.24%), French Canadian (34.4%, a difference of 0.26%), Native Hawaiian (34.3%, a difference of 0.56%), and Ghanaian (34.3%, a difference of 0.70%).
| Demographics | Rating | Rank | Births to Unmarried Women |
| Immigrants | Panama | 3.3 /100 | #227 | Tragic 34.2% |
| Panamanians | 3.3 /100 | #228 | Tragic 34.2% |
| Immigrants | Sierra Leone | 3.1 /100 | #229 | Tragic 34.2% |
| Ghanaians | 3.1 /100 | #230 | Tragic 34.3% |
| Native Hawaiians | 2.9 /100 | #231 | Tragic 34.3% |
| French Canadians | 2.5 /100 | #232 | Tragic 34.4% |
| Bangladeshis | 2.5 /100 | #233 | Tragic 34.4% |
| Immigrants | Zaire | 2.3 /100 | #234 | Tragic 34.5% |
| Immigrants | Ghana | 2.2 /100 | #235 | Tragic 34.5% |
| Immigrants | Cameroon | 1.6 /100 | #236 | Tragic 34.7% |
| Marshallese | 1.6 /100 | #237 | Tragic 34.8% |
| Immigrants | Cambodia | 1.6 /100 | #238 | Tragic 34.8% |
| Sierra Leoneans | 1.4 /100 | #239 | Tragic 34.9% |
| Immigrants | Middle Africa | 1.2 /100 | #240 | Tragic 34.9% |
| Immigrants | Guyana | 1.2 /100 | #241 | Tragic 35.0% |
Demographics Similar to Creek by Births to Unmarried Women
In terms of births to unmarried women, the demographic groups most similar to Creek are Immigrants from Liberia (37.6%, a difference of 0.17%), Immigrants from Guatemala (37.5%, a difference of 0.23%), Immigrants from Mexico (37.5%, a difference of 0.25%), Immigrants from Central America (37.4%, a difference of 0.35%), and Alaskan Athabascan (37.7%, a difference of 0.40%).
| Demographics | Rating | Rank | Births to Unmarried Women |
| Immigrants | St. Vincent and the Grenadines | 0.1 /100 | #280 | Tragic 37.3% |
| Immigrants | Belize | 0.1 /100 | #281 | Tragic 37.3% |
| Liberians | 0.0 /100 | #282 | Tragic 37.4% |
| Spanish American Indians | 0.0 /100 | #283 | Tragic 37.4% |
| Immigrants | Central America | 0.0 /100 | #284 | Tragic 37.4% |
| Immigrants | Mexico | 0.0 /100 | #285 | Tragic 37.5% |
| Immigrants | Guatemala | 0.0 /100 | #286 | Tragic 37.5% |
| Creek | 0.0 /100 | #287 | Tragic 37.6% |
| Immigrants | Liberia | 0.0 /100 | #288 | Tragic 37.6% |
| Alaskan Athabascans | 0.0 /100 | #289 | Tragic 37.7% |
| Hispanics or Latinos | 0.0 /100 | #290 | Tragic 37.8% |
| Seminole | 0.0 /100 | #291 | Tragic 37.9% |
| Blackfeet | 0.0 /100 | #292 | Tragic 37.9% |
| Immigrants | Nicaragua | 0.0 /100 | #293 | Tragic 38.0% |
| British West Indians | 0.0 /100 | #294 | Tragic 38.0% |