Immigrants from Haiti vs Cajun Births to Unmarried Women
COMPARE
Immigrants from Haiti
Cajun
Births to Unmarried Women
Births to Unmarried Women Comparison
Immigrants from Haiti
Cajuns
38.9%
BIRTHS TO UNMARRIED WOMEN
0.0/ 100
METRIC RATING
305th/ 347
METRIC RANK
41.0%
BIRTHS TO UNMARRIED WOMEN
0.0/ 100
METRIC RATING
322nd/ 347
METRIC RANK
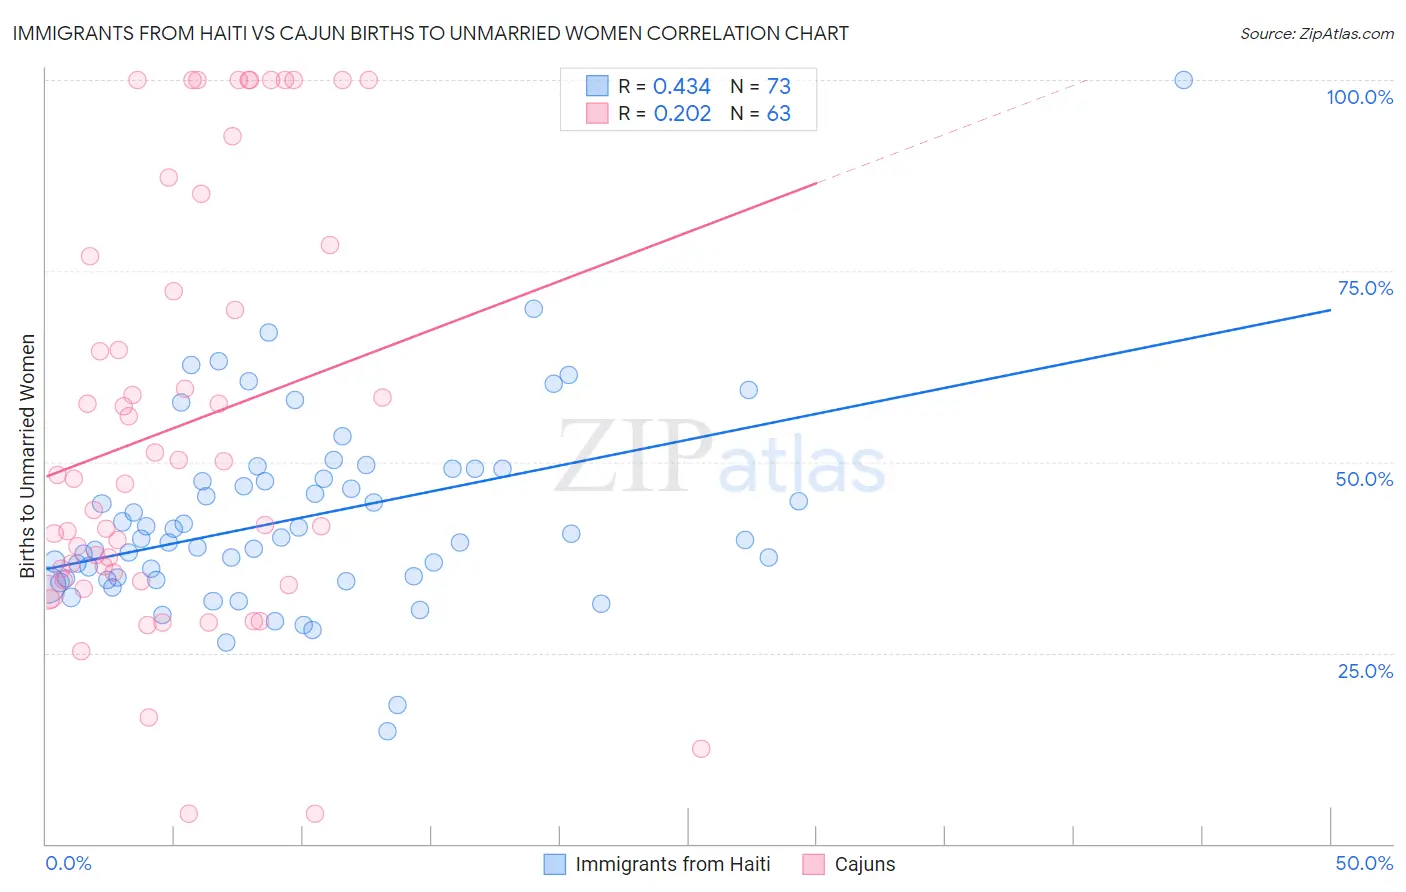
Immigrants from Haiti vs Cajun Births to Unmarried Women Correlation Chart
The statistical analysis conducted on geographies consisting of 215,750,595 people shows a moderate positive correlation between the proportion of Immigrants from Haiti and percentage of births to unmarried women in the United States with a correlation coefficient (R) of 0.434 and weighted average of 38.9%. Similarly, the statistical analysis conducted on geographies consisting of 144,039,196 people shows a weak positive correlation between the proportion of Cajuns and percentage of births to unmarried women in the United States with a correlation coefficient (R) of 0.202 and weighted average of 41.0%, a difference of 5.4%.
Births to Unmarried Women Correlation Summary
| Measurement | Immigrants from Haiti | Cajun |
| Minimum | 14.8% | 4.0% |
| Maximum | 100.0% | 100.0% |
| Range | 85.2% | 96.0% |
| Mean | 42.7% | 54.7% |
| Median | 39.9% | 47.8% |
| Interquartile 25% (IQ1) | 34.7% | 34.6% |
| Interquartile 75% (IQ3) | 48.5% | 76.9% |
| Interquartile Range (IQR) | 13.8% | 42.3% |
| Standard Deviation (Sample) | 12.8% | 27.5% |
| Standard Deviation (Population) | 12.7% | 27.2% |
Demographics Similar to Immigrants from Haiti and Cajuns by Births to Unmarried Women
In terms of births to unmarried women, the demographic groups most similar to Immigrants from Haiti are Yaqui (38.8%, a difference of 0.10%), Immigrants from Jamaica (38.8%, a difference of 0.15%), Central American Indian (39.0%, a difference of 0.29%), Immigrants from Honduras (39.3%, a difference of 1.2%), and Aleut (39.3%, a difference of 1.3%). Similarly, the demographic groups most similar to Cajuns are Sioux (41.0%, a difference of 0.070%), Bahamian (40.8%, a difference of 0.49%), Crow (40.4%, a difference of 1.5%), Yakama (40.3%, a difference of 1.6%), and Immigrants from Bahamas (40.1%, a difference of 2.1%).
| Demographics | Rating | Rank | Births to Unmarried Women |
| Immigrants | Jamaica | 0.0 /100 | #303 | Tragic 38.8% |
| Yaqui | 0.0 /100 | #304 | Tragic 38.8% |
| Immigrants | Haiti | 0.0 /100 | #305 | Tragic 38.9% |
| Central American Indians | 0.0 /100 | #306 | Tragic 39.0% |
| Immigrants | Honduras | 0.0 /100 | #307 | Tragic 39.3% |
| Aleuts | 0.0 /100 | #308 | Tragic 39.3% |
| Cubans | 0.0 /100 | #309 | Tragic 39.4% |
| Immigrants | Dominica | 0.0 /100 | #310 | Tragic 39.5% |
| Immigrants | Azores | 0.0 /100 | #311 | Tragic 39.6% |
| U.S. Virgin Islanders | 0.0 /100 | #312 | Tragic 39.6% |
| Africans | 0.0 /100 | #313 | Tragic 39.7% |
| Immigrants | Caribbean | 0.0 /100 | #314 | Tragic 39.8% |
| Dominicans | 0.0 /100 | #315 | Tragic 39.8% |
| Apache | 0.0 /100 | #316 | Tragic 39.9% |
| Immigrants | Dominican Republic | 0.0 /100 | #317 | Tragic 40.1% |
| Immigrants | Bahamas | 0.0 /100 | #318 | Tragic 40.1% |
| Yakama | 0.0 /100 | #319 | Tragic 40.3% |
| Crow | 0.0 /100 | #320 | Tragic 40.4% |
| Bahamians | 0.0 /100 | #321 | Tragic 40.8% |
| Cajuns | 0.0 /100 | #322 | Tragic 41.0% |
| Sioux | 0.0 /100 | #323 | Tragic 41.0% |