Indonesian vs Cajun Births to Unmarried Women
COMPARE
Indonesian
Cajun
Births to Unmarried Women
Births to Unmarried Women Comparison
Indonesians
Cajuns
35.0%
BIRTHS TO UNMARRIED WOMEN
1.2/ 100
METRIC RATING
242nd/ 347
METRIC RANK
41.0%
BIRTHS TO UNMARRIED WOMEN
0.0/ 100
METRIC RATING
322nd/ 347
METRIC RANK
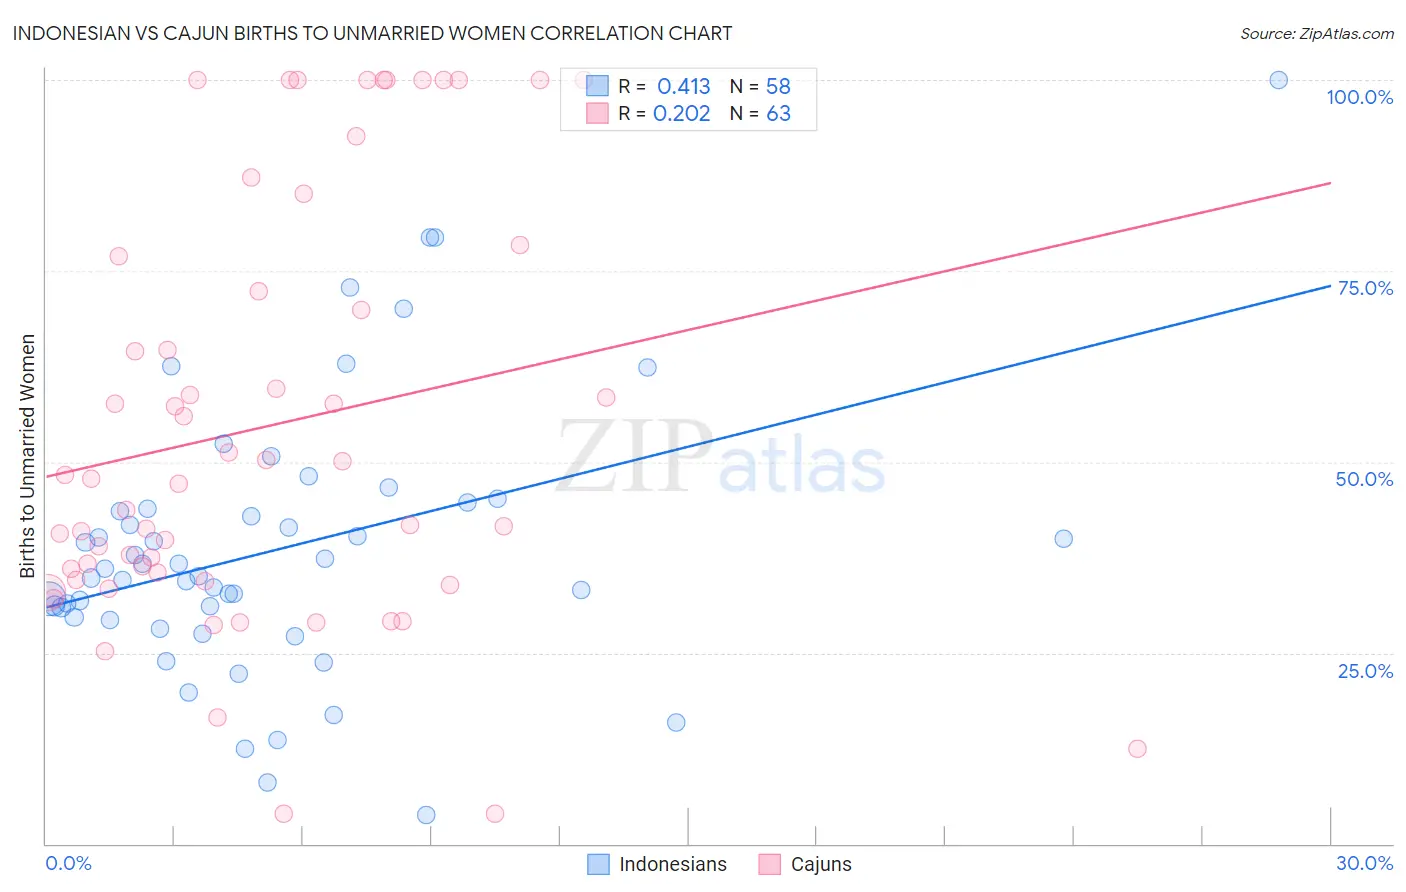
Indonesian vs Cajun Births to Unmarried Women Correlation Chart
The statistical analysis conducted on geographies consisting of 158,009,570 people shows a moderate positive correlation between the proportion of Indonesians and percentage of births to unmarried women in the United States with a correlation coefficient (R) of 0.413 and weighted average of 35.0%. Similarly, the statistical analysis conducted on geographies consisting of 144,039,196 people shows a weak positive correlation between the proportion of Cajuns and percentage of births to unmarried women in the United States with a correlation coefficient (R) of 0.202 and weighted average of 41.0%, a difference of 17.1%.
Births to Unmarried Women Correlation Summary
| Measurement | Indonesian | Cajun |
| Minimum | 3.8% | 4.0% |
| Maximum | 100.0% | 100.0% |
| Range | 96.2% | 96.0% |
| Mean | 38.6% | 54.7% |
| Median | 35.5% | 47.8% |
| Interquartile 25% (IQ1) | 29.6% | 34.6% |
| Interquartile 75% (IQ3) | 43.8% | 76.9% |
| Interquartile Range (IQR) | 14.2% | 42.3% |
| Standard Deviation (Sample) | 17.8% | 27.5% |
| Standard Deviation (Population) | 17.7% | 27.2% |
Similar Demographics by Births to Unmarried Women
Demographics Similar to Indonesians by Births to Unmarried Women
In terms of births to unmarried women, the demographic groups most similar to Indonesians are Immigrants from Guyana (35.0%, a difference of 0.10%), Immigrants from Middle Africa (34.9%, a difference of 0.13%), Sierra Leonean (34.9%, a difference of 0.38%), Japanese (35.2%, a difference of 0.49%), and Guyanese (35.2%, a difference of 0.55%).
| Demographics | Rating | Rank | Births to Unmarried Women |
| Immigrants | Ghana | 2.2 /100 | #235 | Tragic 34.5% |
| Immigrants | Cameroon | 1.6 /100 | #236 | Tragic 34.7% |
| Marshallese | 1.6 /100 | #237 | Tragic 34.8% |
| Immigrants | Cambodia | 1.6 /100 | #238 | Tragic 34.8% |
| Sierra Leoneans | 1.4 /100 | #239 | Tragic 34.9% |
| Immigrants | Middle Africa | 1.2 /100 | #240 | Tragic 34.9% |
| Immigrants | Guyana | 1.2 /100 | #241 | Tragic 35.0% |
| Indonesians | 1.2 /100 | #242 | Tragic 35.0% |
| Japanese | 0.9 /100 | #243 | Tragic 35.2% |
| Guyanese | 0.9 /100 | #244 | Tragic 35.2% |
| Shoshone | 0.8 /100 | #245 | Tragic 35.3% |
| Nigerians | 0.7 /100 | #246 | Tragic 35.3% |
| Immigrants | Nigeria | 0.7 /100 | #247 | Tragic 35.4% |
| Immigrants | Nonimmigrants | 0.6 /100 | #248 | Tragic 35.5% |
| Bermudans | 0.6 /100 | #249 | Tragic 35.5% |
Demographics Similar to Cajuns by Births to Unmarried Women
In terms of births to unmarried women, the demographic groups most similar to Cajuns are Sioux (41.0%, a difference of 0.070%), Bahamian (40.8%, a difference of 0.49%), Cape Verdean (41.3%, a difference of 0.87%), Cheyenne (41.3%, a difference of 0.93%), and Immigrants from Cuba (41.5%, a difference of 1.2%).
| Demographics | Rating | Rank | Births to Unmarried Women |
| Dominicans | 0.0 /100 | #315 | Tragic 39.8% |
| Apache | 0.0 /100 | #316 | Tragic 39.9% |
| Immigrants | Dominican Republic | 0.0 /100 | #317 | Tragic 40.1% |
| Immigrants | Bahamas | 0.0 /100 | #318 | Tragic 40.1% |
| Yakama | 0.0 /100 | #319 | Tragic 40.3% |
| Crow | 0.0 /100 | #320 | Tragic 40.4% |
| Bahamians | 0.0 /100 | #321 | Tragic 40.8% |
| Cajuns | 0.0 /100 | #322 | Tragic 41.0% |
| Sioux | 0.0 /100 | #323 | Tragic 41.0% |
| Cape Verdeans | 0.0 /100 | #324 | Tragic 41.3% |
| Cheyenne | 0.0 /100 | #325 | Tragic 41.3% |
| Immigrants | Cuba | 0.0 /100 | #326 | Tragic 41.5% |
| Tsimshian | 0.0 /100 | #327 | Tragic 42.2% |
| Immigrants | Cabo Verde | 0.0 /100 | #328 | Tragic 42.2% |
| Paiute | 0.0 /100 | #329 | Tragic 42.5% |