Armenian vs Cajun Births to Unmarried Women
COMPARE
Armenian
Cajun
Births to Unmarried Women
Births to Unmarried Women Comparison
Armenians
Cajuns
26.2%
BIRTHS TO UNMARRIED WOMEN
99.9/ 100
METRIC RATING
19th/ 347
METRIC RANK
41.0%
BIRTHS TO UNMARRIED WOMEN
0.0/ 100
METRIC RATING
322nd/ 347
METRIC RANK
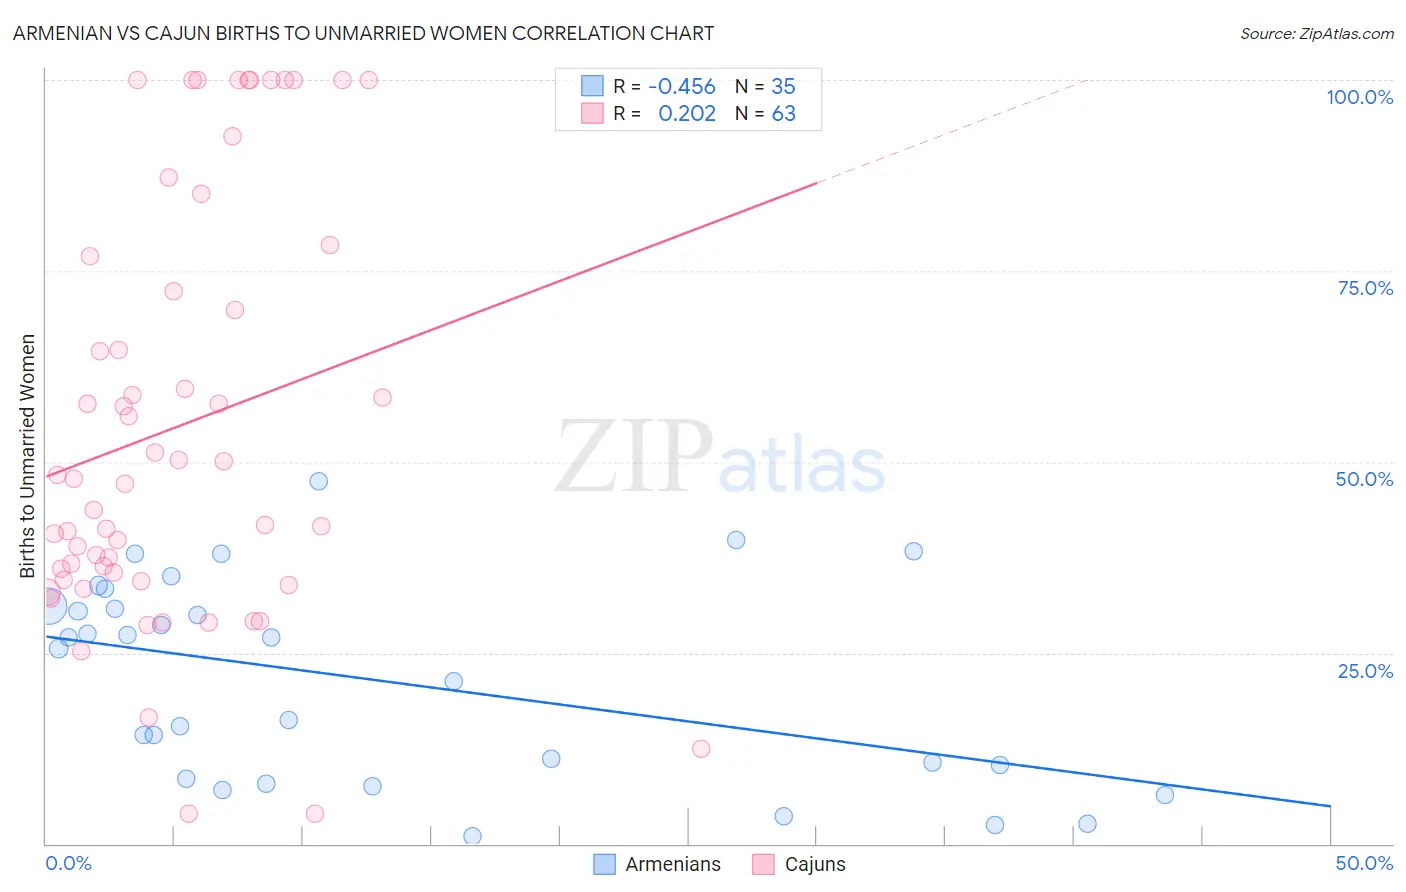
Armenian vs Cajun Births to Unmarried Women Correlation Chart
The statistical analysis conducted on geographies consisting of 289,699,675 people shows a moderate negative correlation between the proportion of Armenians and percentage of births to unmarried women in the United States with a correlation coefficient (R) of -0.456 and weighted average of 26.2%. Similarly, the statistical analysis conducted on geographies consisting of 144,039,196 people shows a weak positive correlation between the proportion of Cajuns and percentage of births to unmarried women in the United States with a correlation coefficient (R) of 0.202 and weighted average of 41.0%, a difference of 56.3%.
Births to Unmarried Women Correlation Summary
| Measurement | Armenian | Cajun |
| Minimum | 1.0% | 4.0% |
| Maximum | 47.5% | 100.0% |
| Range | 46.5% | 96.0% |
| Mean | 21.4% | 54.7% |
| Median | 25.5% | 47.8% |
| Interquartile 25% (IQ1) | 8.5% | 34.6% |
| Interquartile 75% (IQ3) | 31.1% | 76.9% |
| Interquartile Range (IQR) | 22.6% | 42.3% |
| Standard Deviation (Sample) | 13.1% | 27.5% |
| Standard Deviation (Population) | 12.9% | 27.2% |
Similar Demographics by Births to Unmarried Women
Demographics Similar to Armenians by Births to Unmarried Women
In terms of births to unmarried women, the demographic groups most similar to Armenians are Immigrants from Korea (26.3%, a difference of 0.21%), Soviet Union (26.3%, a difference of 0.35%), Burmese (26.4%, a difference of 0.57%), Immigrants from Armenia (26.1%, a difference of 0.58%), and Immigrants from Japan (26.4%, a difference of 0.76%).
| Demographics | Rating | Rank | Births to Unmarried Women |
| Indians (Asian) | 100.0 /100 | #12 | Exceptional 25.3% |
| Iranians | 100.0 /100 | #13 | Exceptional 25.3% |
| Immigrants | Lebanon | 100.0 /100 | #14 | Exceptional 25.3% |
| Immigrants | Singapore | 100.0 /100 | #15 | Exceptional 25.6% |
| Immigrants | Belarus | 100.0 /100 | #16 | Exceptional 25.6% |
| Immigrants | Uzbekistan | 100.0 /100 | #17 | Exceptional 25.8% |
| Immigrants | Armenia | 99.9 /100 | #18 | Exceptional 26.1% |
| Armenians | 99.9 /100 | #19 | Exceptional 26.2% |
| Immigrants | Korea | 99.9 /100 | #20 | Exceptional 26.3% |
| Soviet Union | 99.9 /100 | #21 | Exceptional 26.3% |
| Burmese | 99.9 /100 | #22 | Exceptional 26.4% |
| Immigrants | Japan | 99.9 /100 | #23 | Exceptional 26.4% |
| Immigrants | Australia | 99.9 /100 | #24 | Exceptional 26.6% |
| Cambodians | 99.9 /100 | #25 | Exceptional 26.7% |
| Asians | 99.9 /100 | #26 | Exceptional 26.8% |
Demographics Similar to Cajuns by Births to Unmarried Women
In terms of births to unmarried women, the demographic groups most similar to Cajuns are Sioux (41.0%, a difference of 0.070%), Bahamian (40.8%, a difference of 0.49%), Cape Verdean (41.3%, a difference of 0.87%), Cheyenne (41.3%, a difference of 0.93%), and Immigrants from Cuba (41.5%, a difference of 1.2%).
| Demographics | Rating | Rank | Births to Unmarried Women |
| Dominicans | 0.0 /100 | #315 | Tragic 39.8% |
| Apache | 0.0 /100 | #316 | Tragic 39.9% |
| Immigrants | Dominican Republic | 0.0 /100 | #317 | Tragic 40.1% |
| Immigrants | Bahamas | 0.0 /100 | #318 | Tragic 40.1% |
| Yakama | 0.0 /100 | #319 | Tragic 40.3% |
| Crow | 0.0 /100 | #320 | Tragic 40.4% |
| Bahamians | 0.0 /100 | #321 | Tragic 40.8% |
| Cajuns | 0.0 /100 | #322 | Tragic 41.0% |
| Sioux | 0.0 /100 | #323 | Tragic 41.0% |
| Cape Verdeans | 0.0 /100 | #324 | Tragic 41.3% |
| Cheyenne | 0.0 /100 | #325 | Tragic 41.3% |
| Immigrants | Cuba | 0.0 /100 | #326 | Tragic 41.5% |
| Tsimshian | 0.0 /100 | #327 | Tragic 42.2% |
| Immigrants | Cabo Verde | 0.0 /100 | #328 | Tragic 42.2% |
| Paiute | 0.0 /100 | #329 | Tragic 42.5% |