Immigrants from Zaire vs Cajun Child Poverty Under the Age of 16
COMPARE
Immigrants from Zaire
Cajun
Child Poverty Under the Age of 16
Child Poverty Under the Age of 16 Comparison
Immigrants from Zaire
Cajuns
20.1%
CHILD POVERTY UNDER THE AGE OF 16
0.0/ 100
METRIC RATING
283rd/ 347
METRIC RANK
22.1%
CHILD POVERTY UNDER THE AGE OF 16
0.0/ 100
METRIC RATING
320th/ 347
METRIC RANK
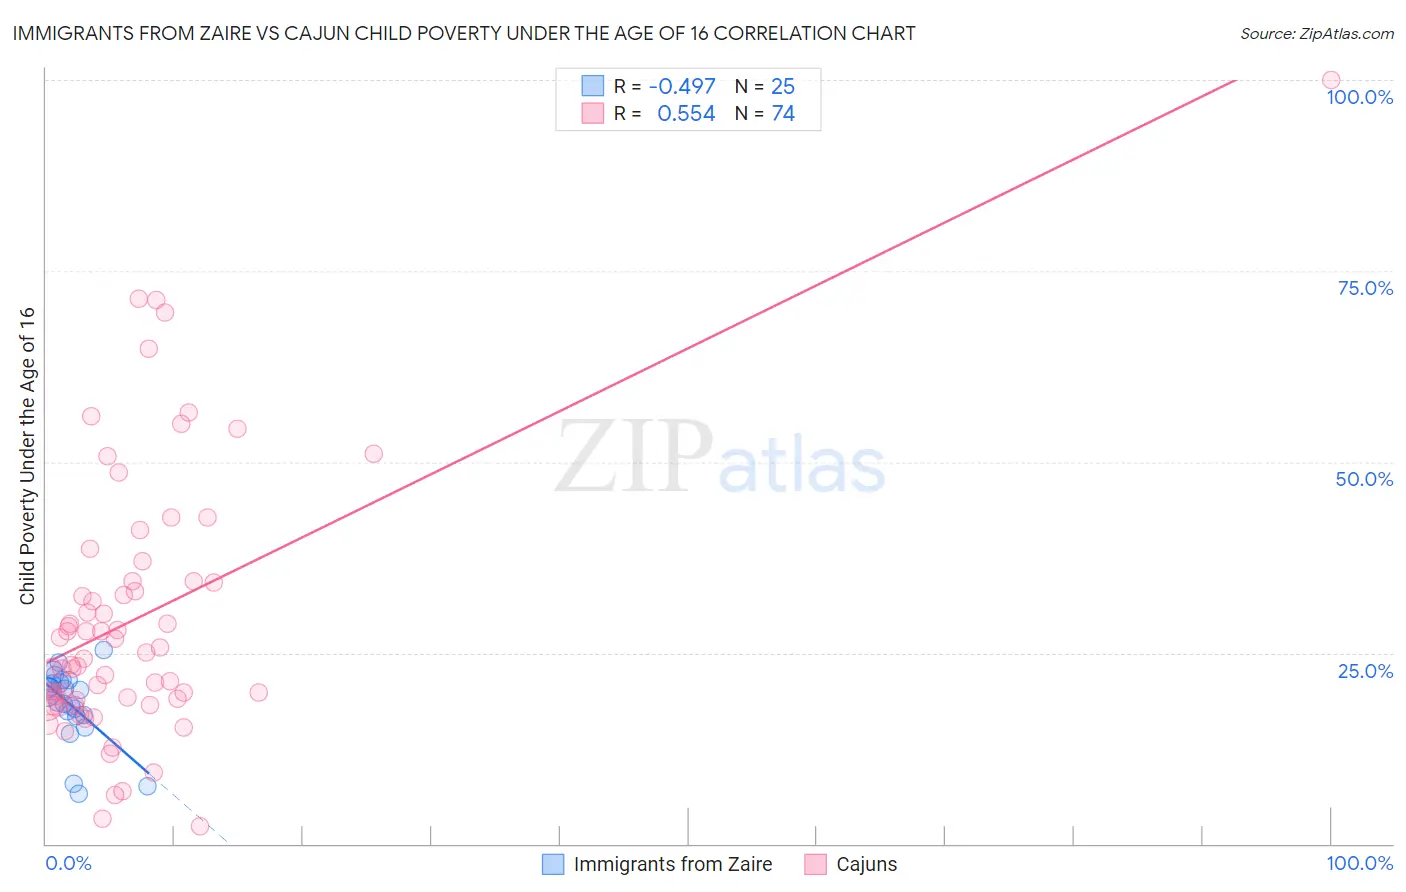
Immigrants from Zaire vs Cajun Child Poverty Under the Age of 16 Correlation Chart
The statistical analysis conducted on geographies consisting of 107,166,496 people shows a moderate negative correlation between the proportion of Immigrants from Zaire and poverty level among children under the age of 16 in the United States with a correlation coefficient (R) of -0.497 and weighted average of 20.1%. Similarly, the statistical analysis conducted on geographies consisting of 149,200,833 people shows a substantial positive correlation between the proportion of Cajuns and poverty level among children under the age of 16 in the United States with a correlation coefficient (R) of 0.554 and weighted average of 22.1%, a difference of 10.0%.
Child Poverty Under the Age of 16 Correlation Summary
| Measurement | Immigrants from Zaire | Cajun |
| Minimum | 6.5% | 2.4% |
| Maximum | 25.4% | 100.0% |
| Range | 18.9% | 97.6% |
| Mean | 18.2% | 29.5% |
| Median | 19.9% | 24.6% |
| Interquartile 25% (IQ1) | 16.8% | 18.9% |
| Interquartile 75% (IQ3) | 21.2% | 34.3% |
| Interquartile Range (IQR) | 4.4% | 15.4% |
| Standard Deviation (Sample) | 4.8% | 17.6% |
| Standard Deviation (Population) | 4.7% | 17.5% |
Similar Demographics by Child Poverty Under the Age of 16
Demographics Similar to Immigrants from Zaire by Child Poverty Under the Age of 16
In terms of child poverty under the age of 16, the demographic groups most similar to Immigrants from Zaire are West Indian (20.1%, a difference of 0.14%), Immigrants from St. Vincent and the Grenadines (20.1%, a difference of 0.21%), Barbadian (20.0%, a difference of 0.23%), Central American (20.0%, a difference of 0.26%), and Immigrants from West Indies (20.2%, a difference of 0.35%).
| Demographics | Rating | Rank | Child Poverty Under the Age of 16 |
| Belizeans | 0.1 /100 | #276 | Tragic 19.9% |
| Iroquois | 0.1 /100 | #277 | Tragic 19.9% |
| Bangladeshis | 0.0 /100 | #278 | Tragic 19.9% |
| Sub-Saharan Africans | 0.0 /100 | #279 | Tragic 19.9% |
| Comanche | 0.0 /100 | #280 | Tragic 19.9% |
| Central Americans | 0.0 /100 | #281 | Tragic 20.0% |
| Barbadians | 0.0 /100 | #282 | Tragic 20.0% |
| Immigrants | Zaire | 0.0 /100 | #283 | Tragic 20.1% |
| West Indians | 0.0 /100 | #284 | Tragic 20.1% |
| Immigrants | St. Vincent and the Grenadines | 0.0 /100 | #285 | Tragic 20.1% |
| Immigrants | West Indies | 0.0 /100 | #286 | Tragic 20.2% |
| Blackfeet | 0.0 /100 | #287 | Tragic 20.2% |
| Immigrants | Belize | 0.0 /100 | #288 | Tragic 20.3% |
| Senegalese | 0.0 /100 | #289 | Tragic 20.4% |
| Yaqui | 0.0 /100 | #290 | Tragic 20.4% |
Demographics Similar to Cajuns by Child Poverty Under the Age of 16
In terms of child poverty under the age of 16, the demographic groups most similar to Cajuns are Kiowa (22.2%, a difference of 0.19%), Yakama (22.1%, a difference of 0.20%), Honduran (22.2%, a difference of 0.37%), U.S. Virgin Islander (22.0%, a difference of 0.71%), and Immigrants from Dominica (21.9%, a difference of 1.1%).
| Demographics | Rating | Rank | Child Poverty Under the Age of 16 |
| Creek | 0.0 /100 | #313 | Tragic 21.5% |
| Immigrants | Somalia | 0.0 /100 | #314 | Tragic 21.6% |
| Immigrants | Guatemala | 0.0 /100 | #315 | Tragic 21.6% |
| Africans | 0.0 /100 | #316 | Tragic 21.7% |
| Immigrants | Dominica | 0.0 /100 | #317 | Tragic 21.9% |
| U.S. Virgin Islanders | 0.0 /100 | #318 | Tragic 22.0% |
| Yakama | 0.0 /100 | #319 | Tragic 22.1% |
| Cajuns | 0.0 /100 | #320 | Tragic 22.1% |
| Kiowa | 0.0 /100 | #321 | Tragic 22.2% |
| Hondurans | 0.0 /100 | #322 | Tragic 22.2% |
| Paiute | 0.0 /100 | #323 | Tragic 22.4% |
| Central American Indians | 0.0 /100 | #324 | Tragic 22.5% |
| Immigrants | Congo | 0.0 /100 | #325 | Tragic 22.5% |
| Immigrants | Honduras | 0.0 /100 | #326 | Tragic 22.7% |
| Menominee | 0.0 /100 | #327 | Tragic 23.0% |