Canadian vs Cajun Births to Unmarried Women
COMPARE
Canadian
Cajun
Births to Unmarried Women
Births to Unmarried Women Comparison
Canadians
Cajuns
31.9%
BIRTHS TO UNMARRIED WOMEN
41.4/ 100
METRIC RATING
183rd/ 347
METRIC RANK
41.0%
BIRTHS TO UNMARRIED WOMEN
0.0/ 100
METRIC RATING
322nd/ 347
METRIC RANK
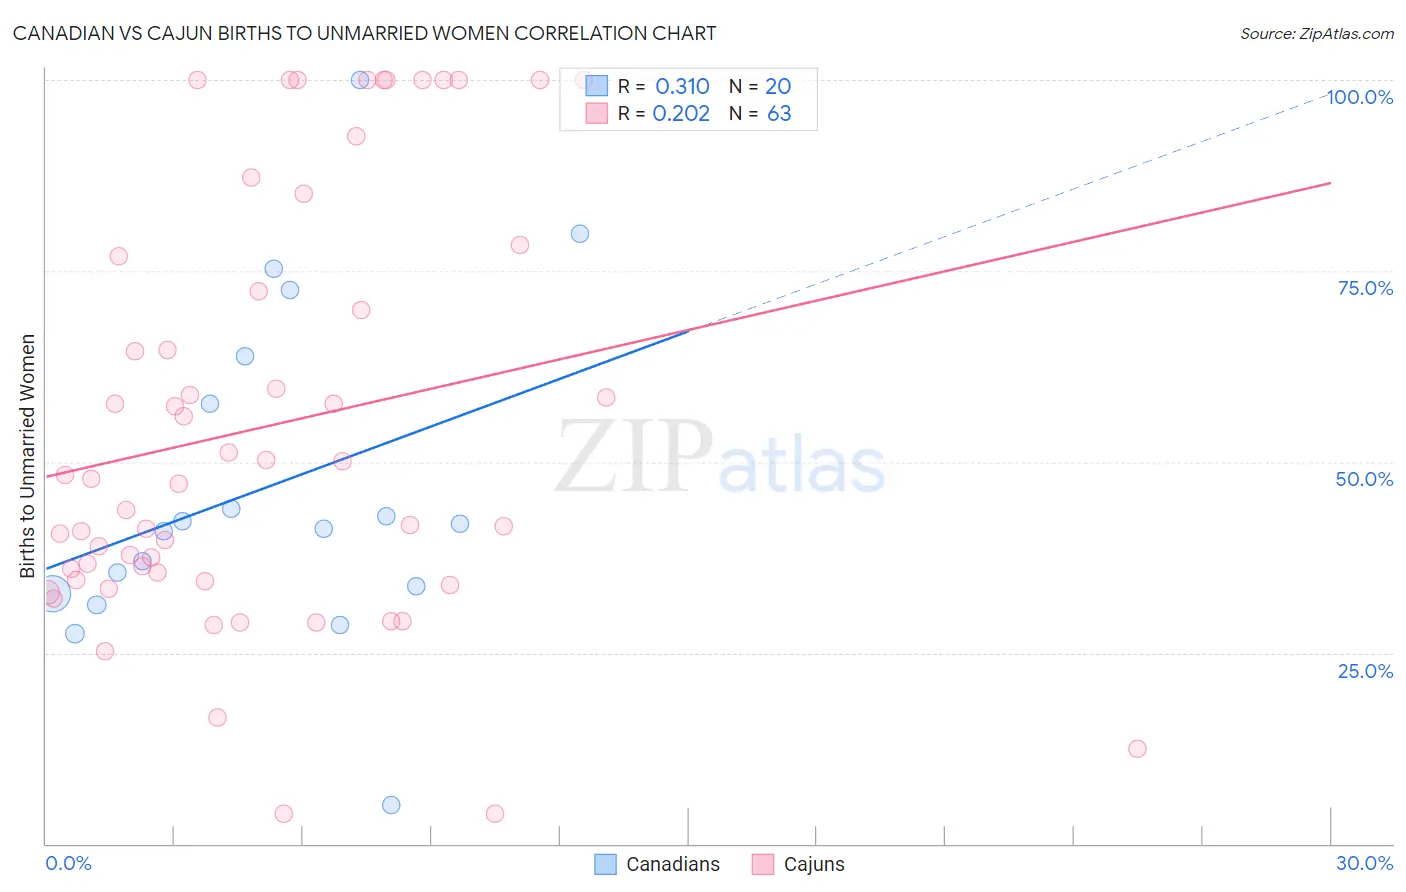
Canadian vs Cajun Births to Unmarried Women Correlation Chart
The statistical analysis conducted on geographies consisting of 401,938,228 people shows a mild positive correlation between the proportion of Canadians and percentage of births to unmarried women in the United States with a correlation coefficient (R) of 0.310 and weighted average of 31.9%. Similarly, the statistical analysis conducted on geographies consisting of 144,039,196 people shows a weak positive correlation between the proportion of Cajuns and percentage of births to unmarried women in the United States with a correlation coefficient (R) of 0.202 and weighted average of 41.0%, a difference of 28.3%.
Births to Unmarried Women Correlation Summary
| Measurement | Canadian | Cajun |
| Minimum | 5.0% | 4.0% |
| Maximum | 100.0% | 100.0% |
| Range | 95.0% | 96.0% |
| Mean | 46.7% | 54.7% |
| Median | 41.6% | 47.8% |
| Interquartile 25% (IQ1) | 33.2% | 34.6% |
| Interquartile 75% (IQ3) | 60.7% | 76.9% |
| Interquartile Range (IQR) | 27.6% | 42.3% |
| Standard Deviation (Sample) | 22.0% | 27.5% |
| Standard Deviation (Population) | 21.5% | 27.2% |
Similar Demographics by Births to Unmarried Women
Demographics Similar to Canadians by Births to Unmarried Women
In terms of births to unmarried women, the demographic groups most similar to Canadians are Immigrants from South America (32.0%, a difference of 0.070%), Kenyan (31.9%, a difference of 0.16%), German (32.0%, a difference of 0.18%), Welsh (32.0%, a difference of 0.31%), and Czechoslovakian (32.0%, a difference of 0.33%).
| Demographics | Rating | Rank | Births to Unmarried Women |
| Scottish | 48.1 /100 | #176 | Average 31.7% |
| South American Indians | 47.7 /100 | #177 | Average 31.7% |
| English | 47.4 /100 | #178 | Average 31.7% |
| South Americans | 46.9 /100 | #179 | Average 31.8% |
| Moroccans | 45.7 /100 | #180 | Average 31.8% |
| Immigrants | Peru | 45.1 /100 | #181 | Average 31.8% |
| Kenyans | 43.0 /100 | #182 | Average 31.9% |
| Canadians | 41.4 /100 | #183 | Average 31.9% |
| Immigrants | South America | 40.7 /100 | #184 | Average 32.0% |
| Germans | 39.5 /100 | #185 | Fair 32.0% |
| Welsh | 38.2 /100 | #186 | Fair 32.0% |
| Czechoslovakians | 38.0 /100 | #187 | Fair 32.0% |
| Osage | 37.1 /100 | #188 | Fair 32.1% |
| Immigrants | Kenya | 36.9 /100 | #189 | Fair 32.1% |
| Tlingit-Haida | 32.6 /100 | #190 | Fair 32.2% |
Demographics Similar to Cajuns by Births to Unmarried Women
In terms of births to unmarried women, the demographic groups most similar to Cajuns are Sioux (41.0%, a difference of 0.070%), Bahamian (40.8%, a difference of 0.49%), Cape Verdean (41.3%, a difference of 0.87%), Cheyenne (41.3%, a difference of 0.93%), and Immigrants from Cuba (41.5%, a difference of 1.2%).
| Demographics | Rating | Rank | Births to Unmarried Women |
| Dominicans | 0.0 /100 | #315 | Tragic 39.8% |
| Apache | 0.0 /100 | #316 | Tragic 39.9% |
| Immigrants | Dominican Republic | 0.0 /100 | #317 | Tragic 40.1% |
| Immigrants | Bahamas | 0.0 /100 | #318 | Tragic 40.1% |
| Yakama | 0.0 /100 | #319 | Tragic 40.3% |
| Crow | 0.0 /100 | #320 | Tragic 40.4% |
| Bahamians | 0.0 /100 | #321 | Tragic 40.8% |
| Cajuns | 0.0 /100 | #322 | Tragic 41.0% |
| Sioux | 0.0 /100 | #323 | Tragic 41.0% |
| Cape Verdeans | 0.0 /100 | #324 | Tragic 41.3% |
| Cheyenne | 0.0 /100 | #325 | Tragic 41.3% |
| Immigrants | Cuba | 0.0 /100 | #326 | Tragic 41.5% |
| Tsimshian | 0.0 /100 | #327 | Tragic 42.2% |
| Immigrants | Cabo Verde | 0.0 /100 | #328 | Tragic 42.2% |
| Paiute | 0.0 /100 | #329 | Tragic 42.5% |