Immigrants from Yemen vs Immigrants from Liberia Married-couple Households
COMPARE
Immigrants from Yemen
Immigrants from Liberia
Married-couple Households
Married-couple Households Comparison
Immigrants from Yemen
Immigrants from Liberia
42.0%
MARRIED-COUPLE HOUSEHOLDS
0.0/ 100
METRIC RATING
294th/ 347
METRIC RANK
40.3%
MARRIED-COUPLE HOUSEHOLDS
0.0/ 100
METRIC RATING
321st/ 347
METRIC RANK
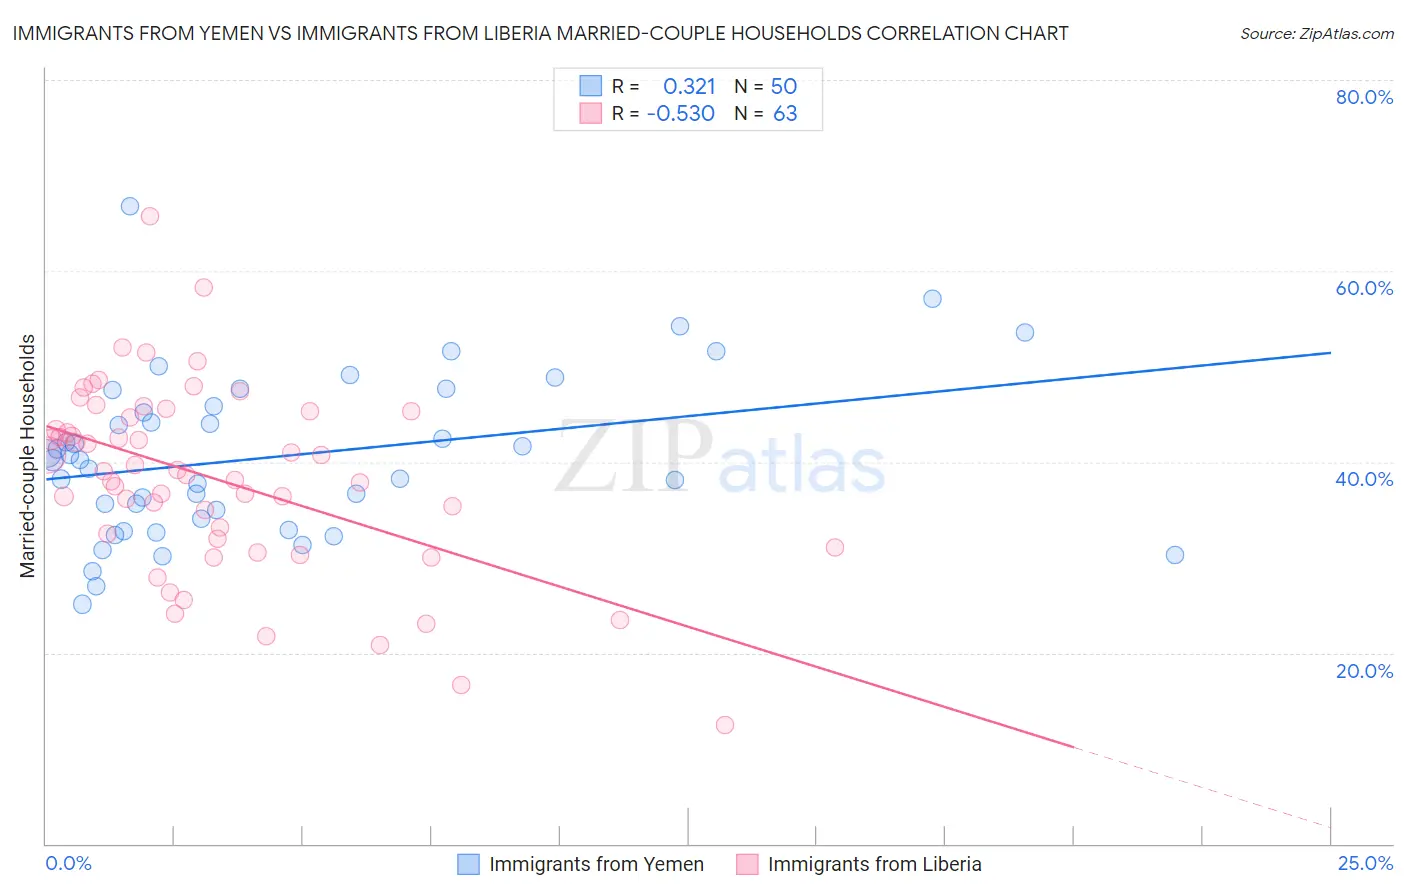
Immigrants from Yemen vs Immigrants from Liberia Married-couple Households Correlation Chart
The statistical analysis conducted on geographies consisting of 82,431,124 people shows a mild positive correlation between the proportion of Immigrants from Yemen and percentage of married-couple family households in the United States with a correlation coefficient (R) of 0.321 and weighted average of 42.0%. Similarly, the statistical analysis conducted on geographies consisting of 135,232,319 people shows a substantial negative correlation between the proportion of Immigrants from Liberia and percentage of married-couple family households in the United States with a correlation coefficient (R) of -0.530 and weighted average of 40.3%, a difference of 4.1%.
Married-couple Households Correlation Summary
| Measurement | Immigrants from Yemen | Immigrants from Liberia |
| Minimum | 25.1% | 12.5% |
| Maximum | 66.7% | 65.7% |
| Range | 41.6% | 53.2% |
| Mean | 40.5% | 38.2% |
| Median | 40.2% | 39.0% |
| Interquartile 25% (IQ1) | 34.0% | 32.0% |
| Interquartile 75% (IQ3) | 45.8% | 45.3% |
| Interquartile Range (IQR) | 11.8% | 13.3% |
| Standard Deviation (Sample) | 8.5% | 9.8% |
| Standard Deviation (Population) | 8.4% | 9.7% |
Similar Demographics by Married-couple Households
Demographics Similar to Immigrants from Yemen by Married-couple Households
In terms of married-couple households, the demographic groups most similar to Immigrants from Yemen are Menominee (42.0%, a difference of 0.0%), Kiowa (42.0%, a difference of 0.0%), Immigrants from Sudan (41.9%, a difference of 0.11%), Indonesian (42.0%, a difference of 0.12%), and Paiute (42.1%, a difference of 0.16%).
| Demographics | Rating | Rank | Married-couple Households |
| Chippewa | 0.0 /100 | #287 | Tragic 42.1% |
| Immigrants | Eritrea | 0.0 /100 | #288 | Tragic 42.1% |
| Sudanese | 0.0 /100 | #289 | Tragic 42.1% |
| Hondurans | 0.0 /100 | #290 | Tragic 42.1% |
| Paiute | 0.0 /100 | #291 | Tragic 42.1% |
| Indonesians | 0.0 /100 | #292 | Tragic 42.0% |
| Menominee | 0.0 /100 | #293 | Tragic 42.0% |
| Immigrants | Yemen | 0.0 /100 | #294 | Tragic 42.0% |
| Kiowa | 0.0 /100 | #295 | Tragic 42.0% |
| Immigrants | Sudan | 0.0 /100 | #296 | Tragic 41.9% |
| Arapaho | 0.0 /100 | #297 | Tragic 41.8% |
| Immigrants | Middle Africa | 0.0 /100 | #298 | Tragic 41.8% |
| Immigrants | Ghana | 0.0 /100 | #299 | Tragic 41.8% |
| Immigrants | Belize | 0.0 /100 | #300 | Tragic 41.8% |
| Immigrants | Bahamas | 0.0 /100 | #301 | Tragic 41.7% |
Demographics Similar to Immigrants from Liberia by Married-couple Households
In terms of married-couple households, the demographic groups most similar to Immigrants from Liberia are West Indian (40.3%, a difference of 0.040%), Bahamian (40.5%, a difference of 0.45%), Immigrants from Zaire (40.1%, a difference of 0.66%), Puerto Rican (40.1%, a difference of 0.66%), and Navajo (40.1%, a difference of 0.67%).
| Demographics | Rating | Rank | Married-couple Households |
| Jamaicans | 0.0 /100 | #314 | Tragic 40.9% |
| Trinidadians and Tobagonians | 0.0 /100 | #315 | Tragic 40.9% |
| Immigrants | Caribbean | 0.0 /100 | #316 | Tragic 40.8% |
| Immigrants | Jamaica | 0.0 /100 | #317 | Tragic 40.7% |
| Liberians | 0.0 /100 | #318 | Tragic 40.7% |
| Bahamians | 0.0 /100 | #319 | Tragic 40.5% |
| West Indians | 0.0 /100 | #320 | Tragic 40.3% |
| Immigrants | Liberia | 0.0 /100 | #321 | Tragic 40.3% |
| Immigrants | Zaire | 0.0 /100 | #322 | Tragic 40.1% |
| Puerto Ricans | 0.0 /100 | #323 | Tragic 40.1% |
| Navajo | 0.0 /100 | #324 | Tragic 40.1% |
| Pueblo | 0.0 /100 | #325 | Tragic 40.0% |
| U.S. Virgin Islanders | 0.0 /100 | #326 | Tragic 39.8% |
| Lumbee | 0.0 /100 | #327 | Tragic 39.6% |
| Barbadians | 0.0 /100 | #328 | Tragic 39.4% |