Immigrants from Yemen vs Immigrants from Barbados Married-couple Households
COMPARE
Immigrants from Yemen
Immigrants from Barbados
Married-couple Households
Married-couple Households Comparison
Immigrants from Yemen
Immigrants from Barbados
42.0%
MARRIED-COUPLE HOUSEHOLDS
0.0/ 100
METRIC RATING
294th/ 347
METRIC RANK
39.2%
MARRIED-COUPLE HOUSEHOLDS
0.0/ 100
METRIC RATING
330th/ 347
METRIC RANK
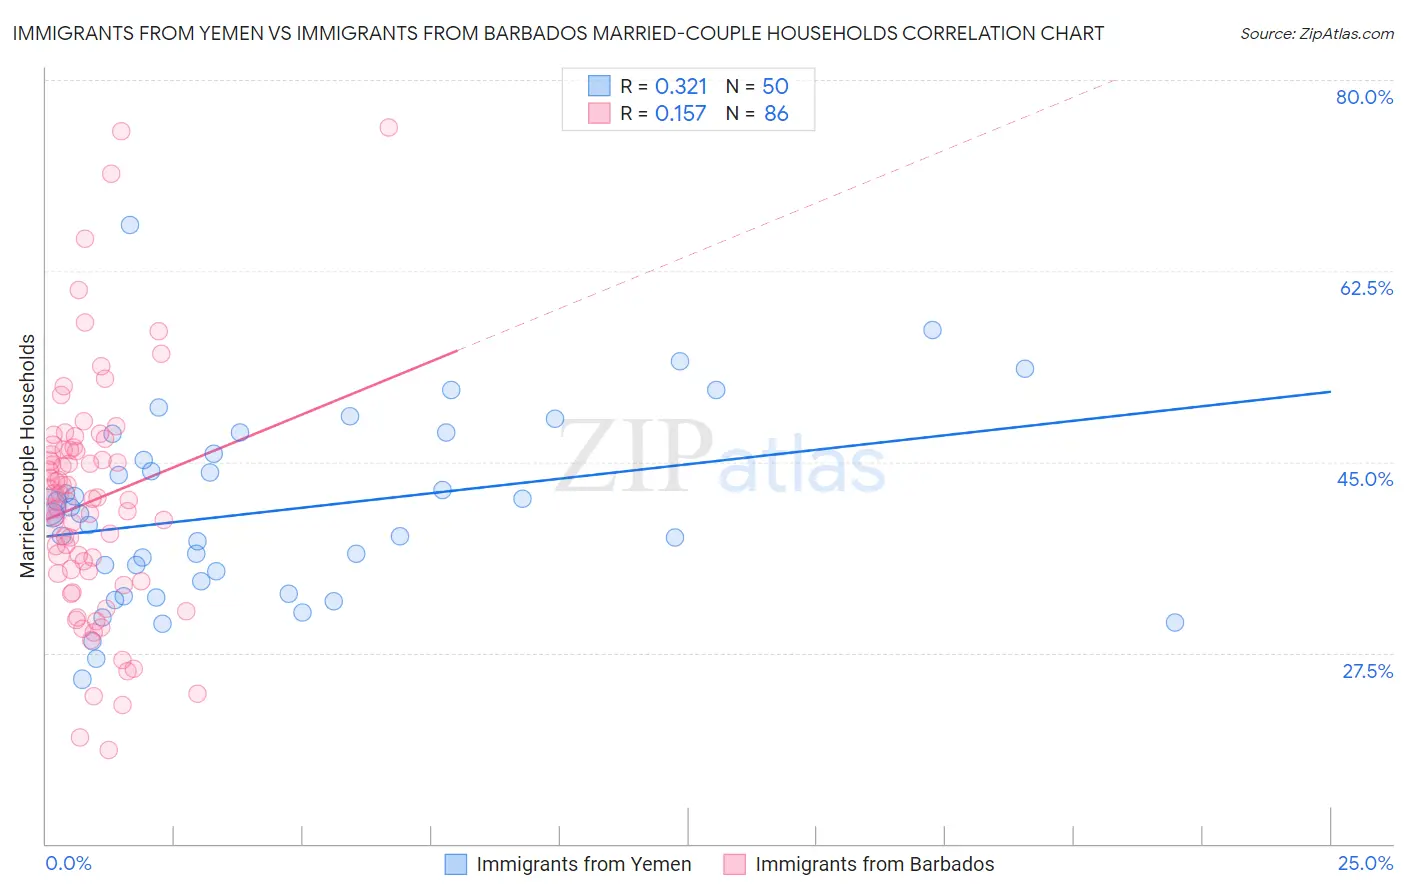
Immigrants from Yemen vs Immigrants from Barbados Married-couple Households Correlation Chart
The statistical analysis conducted on geographies consisting of 82,431,124 people shows a mild positive correlation between the proportion of Immigrants from Yemen and percentage of married-couple family households in the United States with a correlation coefficient (R) of 0.321 and weighted average of 42.0%. Similarly, the statistical analysis conducted on geographies consisting of 112,771,790 people shows a poor positive correlation between the proportion of Immigrants from Barbados and percentage of married-couple family households in the United States with a correlation coefficient (R) of 0.157 and weighted average of 39.2%, a difference of 7.1%.
Married-couple Households Correlation Summary
| Measurement | Immigrants from Yemen | Immigrants from Barbados |
| Minimum | 25.1% | 18.6% |
| Maximum | 66.7% | 75.7% |
| Range | 41.6% | 57.1% |
| Mean | 40.5% | 41.4% |
| Median | 40.2% | 41.6% |
| Interquartile 25% (IQ1) | 34.0% | 34.8% |
| Interquartile 75% (IQ3) | 45.8% | 46.1% |
| Interquartile Range (IQR) | 11.8% | 11.3% |
| Standard Deviation (Sample) | 8.5% | 11.0% |
| Standard Deviation (Population) | 8.4% | 10.9% |
Similar Demographics by Married-couple Households
Demographics Similar to Immigrants from Yemen by Married-couple Households
In terms of married-couple households, the demographic groups most similar to Immigrants from Yemen are Menominee (42.0%, a difference of 0.0%), Kiowa (42.0%, a difference of 0.0%), Immigrants from Sudan (41.9%, a difference of 0.11%), Indonesian (42.0%, a difference of 0.12%), and Paiute (42.1%, a difference of 0.16%).
| Demographics | Rating | Rank | Married-couple Households |
| Chippewa | 0.0 /100 | #287 | Tragic 42.1% |
| Immigrants | Eritrea | 0.0 /100 | #288 | Tragic 42.1% |
| Sudanese | 0.0 /100 | #289 | Tragic 42.1% |
| Hondurans | 0.0 /100 | #290 | Tragic 42.1% |
| Paiute | 0.0 /100 | #291 | Tragic 42.1% |
| Indonesians | 0.0 /100 | #292 | Tragic 42.0% |
| Menominee | 0.0 /100 | #293 | Tragic 42.0% |
| Immigrants | Yemen | 0.0 /100 | #294 | Tragic 42.0% |
| Kiowa | 0.0 /100 | #295 | Tragic 42.0% |
| Immigrants | Sudan | 0.0 /100 | #296 | Tragic 41.9% |
| Arapaho | 0.0 /100 | #297 | Tragic 41.8% |
| Immigrants | Middle Africa | 0.0 /100 | #298 | Tragic 41.8% |
| Immigrants | Ghana | 0.0 /100 | #299 | Tragic 41.8% |
| Immigrants | Belize | 0.0 /100 | #300 | Tragic 41.8% |
| Immigrants | Bahamas | 0.0 /100 | #301 | Tragic 41.7% |
Demographics Similar to Immigrants from Barbados by Married-couple Households
In terms of married-couple households, the demographic groups most similar to Immigrants from Barbados are Immigrants from Dominica (39.4%, a difference of 0.44%), Immigrants from Congo (39.0%, a difference of 0.44%), Barbadian (39.4%, a difference of 0.52%), Somali (39.0%, a difference of 0.52%), and Immigrants from West Indies (39.0%, a difference of 0.56%).
| Demographics | Rating | Rank | Married-couple Households |
| Puerto Ricans | 0.0 /100 | #323 | Tragic 40.1% |
| Navajo | 0.0 /100 | #324 | Tragic 40.1% |
| Pueblo | 0.0 /100 | #325 | Tragic 40.0% |
| U.S. Virgin Islanders | 0.0 /100 | #326 | Tragic 39.8% |
| Lumbee | 0.0 /100 | #327 | Tragic 39.6% |
| Barbadians | 0.0 /100 | #328 | Tragic 39.4% |
| Immigrants | Dominica | 0.0 /100 | #329 | Tragic 39.4% |
| Immigrants | Barbados | 0.0 /100 | #330 | Tragic 39.2% |
| Immigrants | Congo | 0.0 /100 | #331 | Tragic 39.0% |
| Somalis | 0.0 /100 | #332 | Tragic 39.0% |
| Immigrants | West Indies | 0.0 /100 | #333 | Tragic 39.0% |
| Immigrants | St. Vincent and the Grenadines | 0.0 /100 | #334 | Tragic 38.7% |
| Senegalese | 0.0 /100 | #335 | Tragic 38.6% |
| Blacks/African Americans | 0.0 /100 | #336 | Tragic 38.5% |
| Immigrants | Somalia | 0.0 /100 | #337 | Tragic 38.4% |