Immigrants from Netherlands vs Immigrants from Liberia Married-couple Households
COMPARE
Immigrants from Netherlands
Immigrants from Liberia
Married-couple Households
Married-couple Households Comparison
Immigrants from Netherlands
Immigrants from Liberia
48.2%
MARRIED-COUPLE HOUSEHOLDS
98.2/ 100
METRIC RATING
79th/ 347
METRIC RANK
40.3%
MARRIED-COUPLE HOUSEHOLDS
0.0/ 100
METRIC RATING
321st/ 347
METRIC RANK
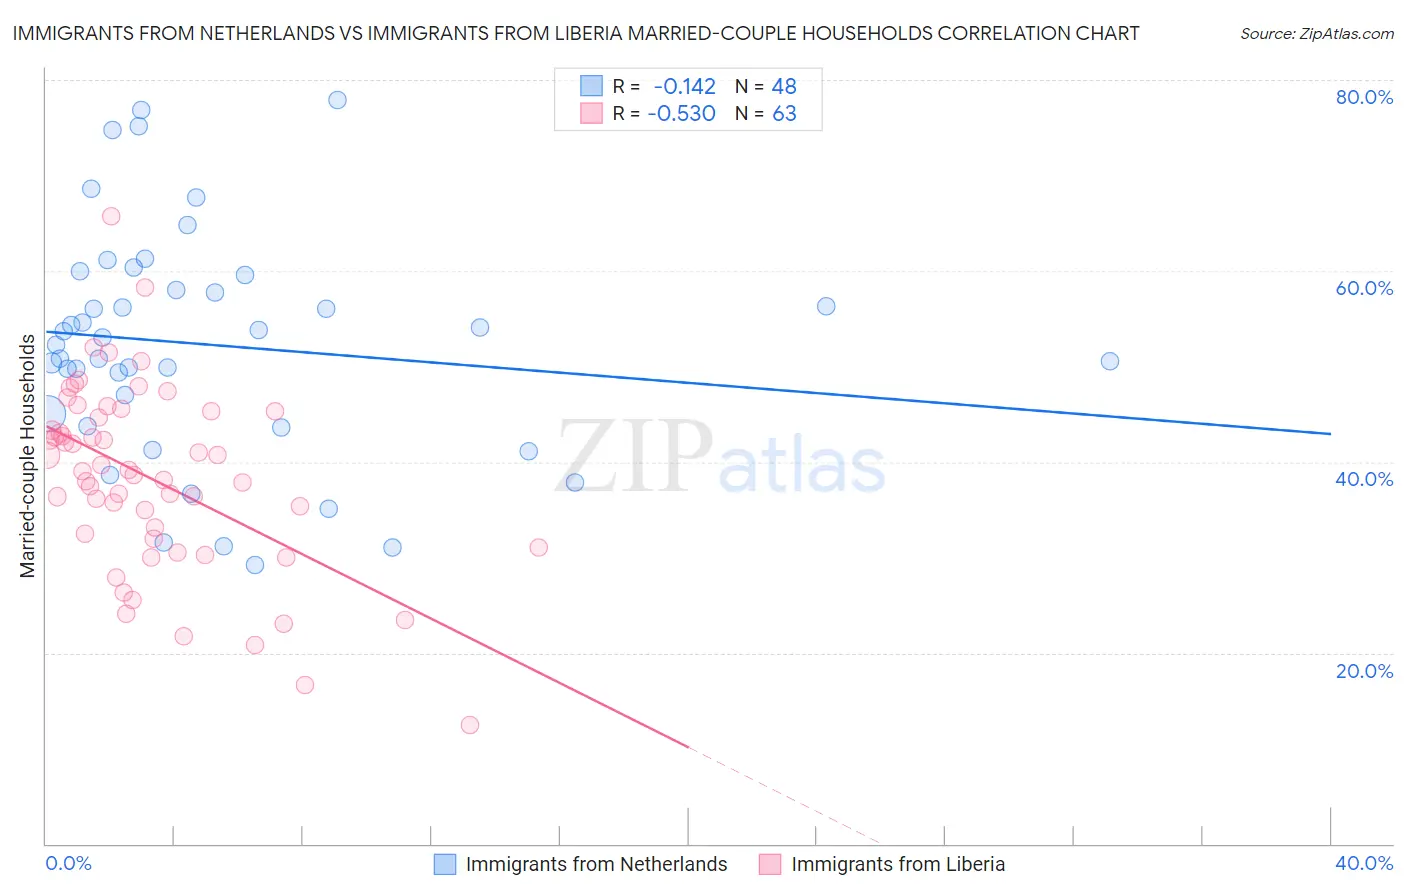
Immigrants from Netherlands vs Immigrants from Liberia Married-couple Households Correlation Chart
The statistical analysis conducted on geographies consisting of 237,797,342 people shows a poor negative correlation between the proportion of Immigrants from Netherlands and percentage of married-couple family households in the United States with a correlation coefficient (R) of -0.142 and weighted average of 48.2%. Similarly, the statistical analysis conducted on geographies consisting of 135,232,319 people shows a substantial negative correlation between the proportion of Immigrants from Liberia and percentage of married-couple family households in the United States with a correlation coefficient (R) of -0.530 and weighted average of 40.3%, a difference of 19.5%.
Married-couple Households Correlation Summary
| Measurement | Immigrants from Netherlands | Immigrants from Liberia |
| Minimum | 29.2% | 12.5% |
| Maximum | 77.9% | 65.7% |
| Range | 48.7% | 53.2% |
| Mean | 52.3% | 38.2% |
| Median | 52.7% | 39.0% |
| Interquartile 25% (IQ1) | 44.4% | 32.0% |
| Interquartile 75% (IQ3) | 58.8% | 45.3% |
| Interquartile Range (IQR) | 14.4% | 13.3% |
| Standard Deviation (Sample) | 12.0% | 9.8% |
| Standard Deviation (Population) | 11.9% | 9.7% |
Similar Demographics by Married-couple Households
Demographics Similar to Immigrants from Netherlands by Married-couple Households
In terms of married-couple households, the demographic groups most similar to Immigrants from Netherlands are Egyptian (48.2%, a difference of 0.010%), Russian (48.2%, a difference of 0.020%), Canadian (48.2%, a difference of 0.030%), Finnish (48.1%, a difference of 0.090%), and Immigrants from Fiji (48.2%, a difference of 0.12%).
| Demographics | Rating | Rank | Married-couple Households |
| Scotch-Irish | 98.6 /100 | #72 | Exceptional 48.3% |
| Immigrants | Singapore | 98.6 /100 | #73 | Exceptional 48.3% |
| Immigrants | Romania | 98.6 /100 | #74 | Exceptional 48.3% |
| Immigrants | England | 98.4 /100 | #75 | Exceptional 48.2% |
| Immigrants | Fiji | 98.4 /100 | #76 | Exceptional 48.2% |
| Canadians | 98.2 /100 | #77 | Exceptional 48.2% |
| Egyptians | 98.2 /100 | #78 | Exceptional 48.2% |
| Immigrants | Netherlands | 98.2 /100 | #79 | Exceptional 48.2% |
| Russians | 98.1 /100 | #80 | Exceptional 48.2% |
| Finns | 98.0 /100 | #81 | Exceptional 48.1% |
| Immigrants | Poland | 97.7 /100 | #82 | Exceptional 48.1% |
| Guamanians/Chamorros | 97.6 /100 | #83 | Exceptional 48.1% |
| Ukrainians | 97.6 /100 | #84 | Exceptional 48.1% |
| Immigrants | Israel | 97.4 /100 | #85 | Exceptional 48.0% |
| Belgians | 97.4 /100 | #86 | Exceptional 48.0% |
Demographics Similar to Immigrants from Liberia by Married-couple Households
In terms of married-couple households, the demographic groups most similar to Immigrants from Liberia are West Indian (40.3%, a difference of 0.040%), Bahamian (40.5%, a difference of 0.45%), Immigrants from Zaire (40.1%, a difference of 0.66%), Puerto Rican (40.1%, a difference of 0.66%), and Navajo (40.1%, a difference of 0.67%).
| Demographics | Rating | Rank | Married-couple Households |
| Jamaicans | 0.0 /100 | #314 | Tragic 40.9% |
| Trinidadians and Tobagonians | 0.0 /100 | #315 | Tragic 40.9% |
| Immigrants | Caribbean | 0.0 /100 | #316 | Tragic 40.8% |
| Immigrants | Jamaica | 0.0 /100 | #317 | Tragic 40.7% |
| Liberians | 0.0 /100 | #318 | Tragic 40.7% |
| Bahamians | 0.0 /100 | #319 | Tragic 40.5% |
| West Indians | 0.0 /100 | #320 | Tragic 40.3% |
| Immigrants | Liberia | 0.0 /100 | #321 | Tragic 40.3% |
| Immigrants | Zaire | 0.0 /100 | #322 | Tragic 40.1% |
| Puerto Ricans | 0.0 /100 | #323 | Tragic 40.1% |
| Navajo | 0.0 /100 | #324 | Tragic 40.1% |
| Pueblo | 0.0 /100 | #325 | Tragic 40.0% |
| U.S. Virgin Islanders | 0.0 /100 | #326 | Tragic 39.8% |
| Lumbee | 0.0 /100 | #327 | Tragic 39.6% |
| Barbadians | 0.0 /100 | #328 | Tragic 39.4% |