Immigrants from Yemen vs Immigrants from Liberia In Labor Force | Age > 16
COMPARE
Immigrants from Yemen
Immigrants from Liberia
In Labor Force | Age > 16
In Labor Force | Age > 16 Comparison
Immigrants from Yemen
Immigrants from Liberia
59.6%
IN LABOR FORCE | AGE > 16
0.0/ 100
METRIC RATING
338th/ 347
METRIC RANK
67.6%
IN LABOR FORCE | AGE > 16
100.0/ 100
METRIC RATING
18th/ 347
METRIC RANK
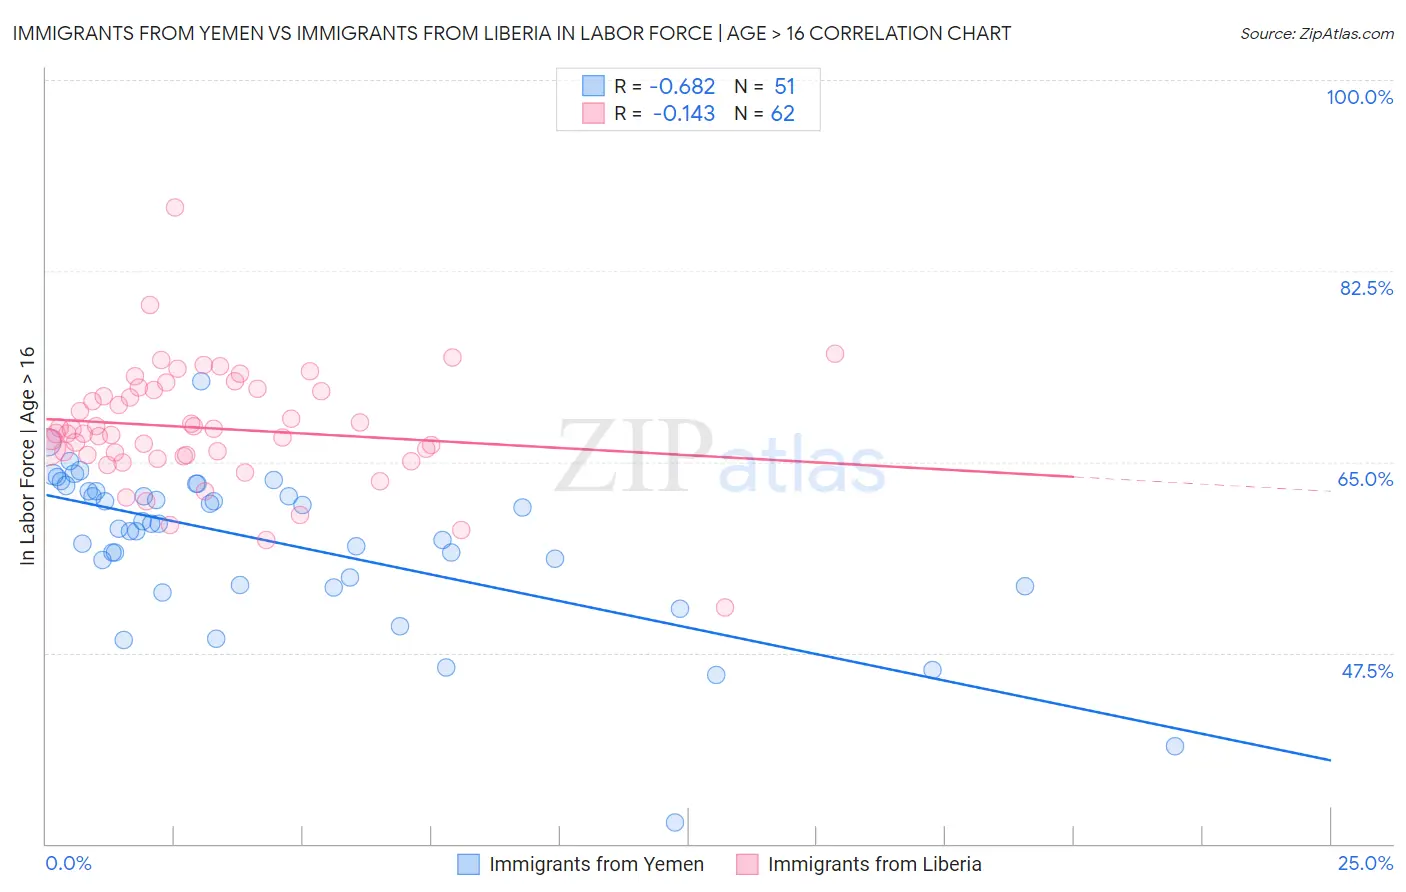
Immigrants from Yemen vs Immigrants from Liberia In Labor Force | Age > 16 Correlation Chart
The statistical analysis conducted on geographies consisting of 82,433,611 people shows a significant negative correlation between the proportion of Immigrants from Yemen and labor force participation rate among population ages 16 and over in the United States with a correlation coefficient (R) of -0.682 and weighted average of 59.6%. Similarly, the statistical analysis conducted on geographies consisting of 135,283,849 people shows a poor negative correlation between the proportion of Immigrants from Liberia and labor force participation rate among population ages 16 and over in the United States with a correlation coefficient (R) of -0.143 and weighted average of 67.6%, a difference of 13.4%.
In Labor Force | Age > 16 Correlation Summary
| Measurement | Immigrants from Yemen | Immigrants from Liberia |
| Minimum | 32.0% | 51.7% |
| Maximum | 72.4% | 88.3% |
| Range | 40.4% | 36.6% |
| Mean | 57.6% | 68.1% |
| Median | 59.3% | 67.6% |
| Interquartile 25% (IQ1) | 53.7% | 65.6% |
| Interquartile 75% (IQ3) | 62.3% | 71.5% |
| Interquartile Range (IQR) | 8.6% | 6.0% |
| Standard Deviation (Sample) | 7.2% | 5.4% |
| Standard Deviation (Population) | 7.2% | 5.4% |
Similar Demographics by In Labor Force | Age > 16
Demographics Similar to Immigrants from Yemen by In Labor Force | Age > 16
In terms of in labor force | age > 16, the demographic groups most similar to Immigrants from Yemen are Houma (59.5%, a difference of 0.25%), Colville (59.8%, a difference of 0.27%), Pueblo (59.3%, a difference of 0.64%), Menominee (60.6%, a difference of 1.5%), and Native/Alaskan (60.6%, a difference of 1.6%).
| Demographics | Rating | Rank | In Labor Force | Age > 16 |
| Ute | 0.0 /100 | #331 | Tragic 60.9% |
| Crow | 0.0 /100 | #332 | Tragic 60.8% |
| Paiute | 0.0 /100 | #333 | Tragic 60.7% |
| Apache | 0.0 /100 | #334 | Tragic 60.7% |
| Natives/Alaskans | 0.0 /100 | #335 | Tragic 60.6% |
| Menominee | 0.0 /100 | #336 | Tragic 60.6% |
| Colville | 0.0 /100 | #337 | Tragic 59.8% |
| Immigrants | Yemen | 0.0 /100 | #338 | Tragic 59.6% |
| Houma | 0.0 /100 | #339 | Tragic 59.5% |
| Pueblo | 0.0 /100 | #340 | Tragic 59.3% |
| Hopi | 0.0 /100 | #341 | Tragic 58.4% |
| Puerto Ricans | 0.0 /100 | #342 | Tragic 58.1% |
| Yuman | 0.0 /100 | #343 | Tragic 57.8% |
| Pima | 0.0 /100 | #344 | Tragic 57.4% |
| Tohono O'odham | 0.0 /100 | #345 | Tragic 57.2% |
Demographics Similar to Immigrants from Liberia by In Labor Force | Age > 16
In terms of in labor force | age > 16, the demographic groups most similar to Immigrants from Liberia are Immigrants from India (67.6%, a difference of 0.020%), Kenyan (67.6%, a difference of 0.040%), Immigrants from Sudan (67.7%, a difference of 0.090%), Immigrants from Kenya (67.6%, a difference of 0.090%), and Tongan (67.5%, a difference of 0.10%).
| Demographics | Rating | Rank | In Labor Force | Age > 16 |
| Bolivians | 100.0 /100 | #11 | Exceptional 68.2% |
| Sudanese | 100.0 /100 | #12 | Exceptional 68.0% |
| Immigrants | Nepal | 100.0 /100 | #13 | Exceptional 68.0% |
| Liberians | 100.0 /100 | #14 | Exceptional 67.8% |
| Immigrants | Middle Africa | 100.0 /100 | #15 | Exceptional 67.7% |
| Immigrants | Sudan | 100.0 /100 | #16 | Exceptional 67.7% |
| Immigrants | India | 100.0 /100 | #17 | Exceptional 67.6% |
| Immigrants | Liberia | 100.0 /100 | #18 | Exceptional 67.6% |
| Kenyans | 100.0 /100 | #19 | Exceptional 67.6% |
| Immigrants | Kenya | 100.0 /100 | #20 | Exceptional 67.6% |
| Tongans | 100.0 /100 | #21 | Exceptional 67.5% |
| Immigrants | Uganda | 100.0 /100 | #22 | Exceptional 67.5% |
| Cambodians | 100.0 /100 | #23 | Exceptional 67.4% |
| Ugandans | 100.0 /100 | #24 | Exceptional 67.4% |
| Immigrants | Africa | 100.0 /100 | #25 | Exceptional 67.4% |