Immigrants from Uzbekistan vs Immigrants from Malaysia Single Mother Households
COMPARE
Immigrants from Uzbekistan
Immigrants from Malaysia
Single Mother Households
Single Mother Households Comparison
Immigrants from Uzbekistan
Immigrants from Malaysia
5.9%
SINGLE MOTHER HOUSEHOLDS
93.4/ 100
METRIC RATING
123rd/ 347
METRIC RANK
5.7%
SINGLE MOTHER HOUSEHOLDS
97.8/ 100
METRIC RATING
82nd/ 347
METRIC RANK
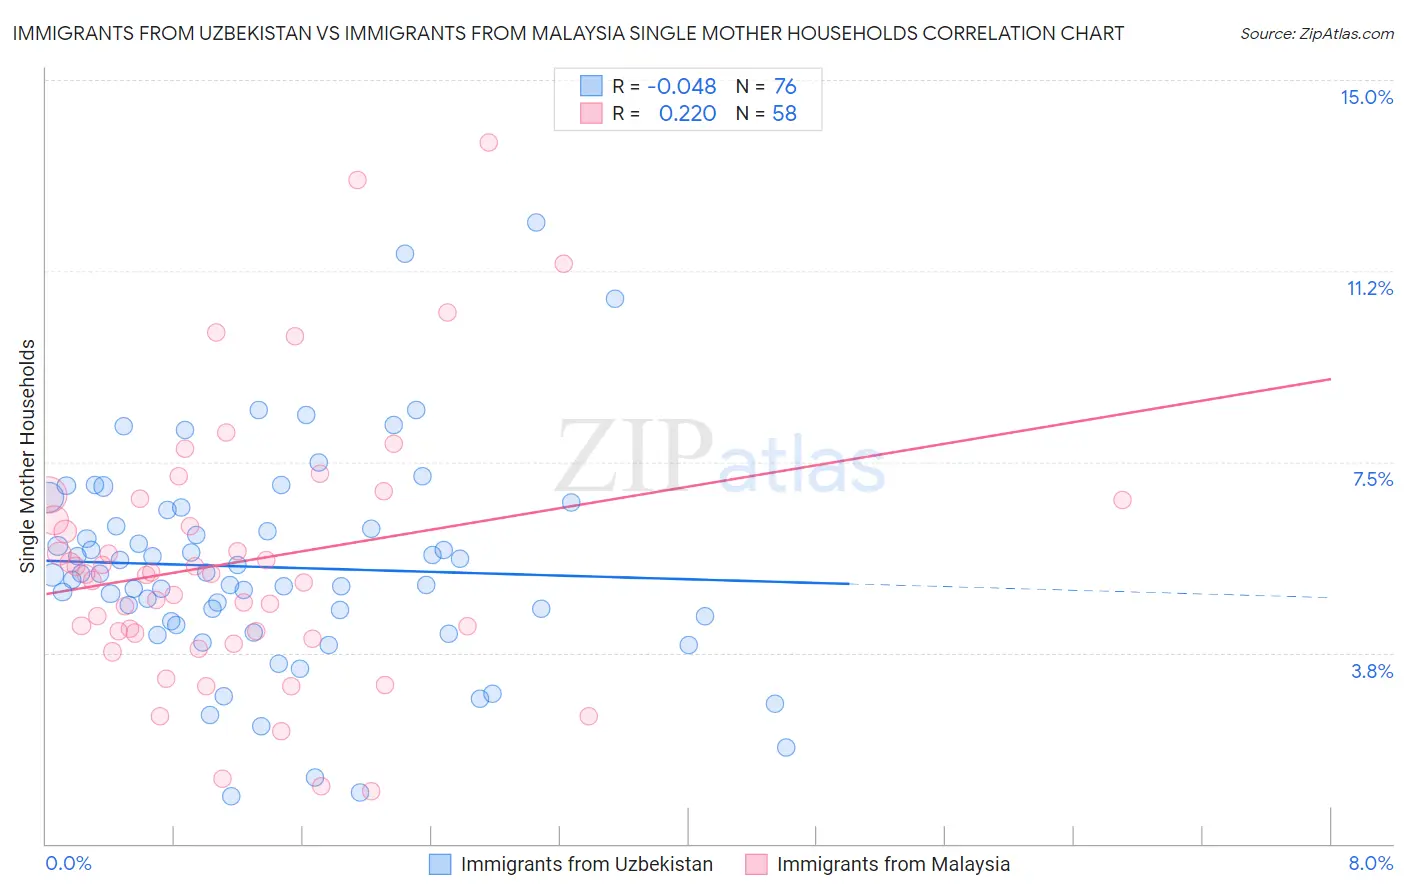
Immigrants from Uzbekistan vs Immigrants from Malaysia Single Mother Households Correlation Chart
The statistical analysis conducted on geographies consisting of 118,578,546 people shows no correlation between the proportion of Immigrants from Uzbekistan and percentage of single mother households in the United States with a correlation coefficient (R) of -0.048 and weighted average of 5.9%. Similarly, the statistical analysis conducted on geographies consisting of 197,805,360 people shows a weak positive correlation between the proportion of Immigrants from Malaysia and percentage of single mother households in the United States with a correlation coefficient (R) of 0.220 and weighted average of 5.7%, a difference of 3.5%.
Single Mother Households Correlation Summary
| Measurement | Immigrants from Uzbekistan | Immigrants from Malaysia |
| Minimum | 0.94% | 1.0% |
| Maximum | 12.2% | 13.8% |
| Range | 11.3% | 12.7% |
| Mean | 5.4% | 5.5% |
| Median | 5.3% | 5.3% |
| Interquartile 25% (IQ1) | 4.3% | 4.1% |
| Interquartile 75% (IQ3) | 6.4% | 6.8% |
| Interquartile Range (IQR) | 2.1% | 2.6% |
| Standard Deviation (Sample) | 2.1% | 2.6% |
| Standard Deviation (Population) | 2.1% | 2.6% |
Similar Demographics by Single Mother Households
Demographics Similar to Immigrants from Uzbekistan by Single Mother Households
In terms of single mother households, the demographic groups most similar to Immigrants from Uzbekistan are Belgian (5.8%, a difference of 0.060%), Immigrants from Argentina (5.9%, a difference of 0.070%), Argentinean (5.8%, a difference of 0.14%), Tongan (5.8%, a difference of 0.17%), and Slavic (5.9%, a difference of 0.23%).
| Demographics | Rating | Rank | Single Mother Households |
| Pennsylvania Germans | 94.7 /100 | #116 | Exceptional 5.8% |
| Bolivians | 94.6 /100 | #117 | Exceptional 5.8% |
| Laotians | 94.3 /100 | #118 | Exceptional 5.8% |
| South Africans | 94.1 /100 | #119 | Exceptional 5.8% |
| Tongans | 93.7 /100 | #120 | Exceptional 5.8% |
| Argentineans | 93.7 /100 | #121 | Exceptional 5.8% |
| Belgians | 93.5 /100 | #122 | Exceptional 5.8% |
| Immigrants | Uzbekistan | 93.4 /100 | #123 | Exceptional 5.9% |
| Immigrants | Argentina | 93.2 /100 | #124 | Exceptional 5.9% |
| Slavs | 92.9 /100 | #125 | Exceptional 5.9% |
| Welsh | 92.8 /100 | #126 | Exceptional 5.9% |
| Lebanese | 92.4 /100 | #127 | Exceptional 5.9% |
| Czechoslovakians | 92.2 /100 | #128 | Exceptional 5.9% |
| Immigrants | Bolivia | 92.2 /100 | #129 | Exceptional 5.9% |
| Palestinians | 92.1 /100 | #130 | Exceptional 5.9% |
Demographics Similar to Immigrants from Malaysia by Single Mother Households
In terms of single mother households, the demographic groups most similar to Immigrants from Malaysia are Immigrants from Hungary (5.7%, a difference of 0.030%), Carpatho Rusyn (5.7%, a difference of 0.10%), Immigrants from Moldova (5.6%, a difference of 0.21%), Czech (5.6%, a difference of 0.22%), and Hungarian (5.7%, a difference of 0.25%).
| Demographics | Rating | Rank | Single Mother Households |
| Slovenes | 98.3 /100 | #75 | Exceptional 5.6% |
| New Zealanders | 98.2 /100 | #76 | Exceptional 5.6% |
| Romanians | 98.1 /100 | #77 | Exceptional 5.6% |
| Swiss | 98.1 /100 | #78 | Exceptional 5.6% |
| Immigrants | Sri Lanka | 98.0 /100 | #79 | Exceptional 5.6% |
| Czechs | 97.9 /100 | #80 | Exceptional 5.6% |
| Immigrants | Moldova | 97.9 /100 | #81 | Exceptional 5.6% |
| Immigrants | Malaysia | 97.8 /100 | #82 | Exceptional 5.7% |
| Immigrants | Hungary | 97.8 /100 | #83 | Exceptional 5.7% |
| Carpatho Rusyns | 97.7 /100 | #84 | Exceptional 5.7% |
| Hungarians | 97.6 /100 | #85 | Exceptional 5.7% |
| Finns | 97.6 /100 | #86 | Exceptional 5.7% |
| Immigrants | Turkey | 97.5 /100 | #87 | Exceptional 5.7% |
| Israelis | 97.4 /100 | #88 | Exceptional 5.7% |
| Ukrainians | 97.2 /100 | #89 | Exceptional 5.7% |