Immigrants from Uzbekistan vs Immigrants from Germany Associate's Degree
COMPARE
Immigrants from Uzbekistan
Immigrants from Germany
Associate's Degree
Associate's Degree Comparison
Immigrants from Uzbekistan
Immigrants from Germany
50.3%
ASSOCIATE'S DEGREE
98.9/ 100
METRIC RATING
83rd/ 347
METRIC RANK
47.1%
ASSOCIATE'S DEGREE
69.7/ 100
METRIC RATING
158th/ 347
METRIC RANK
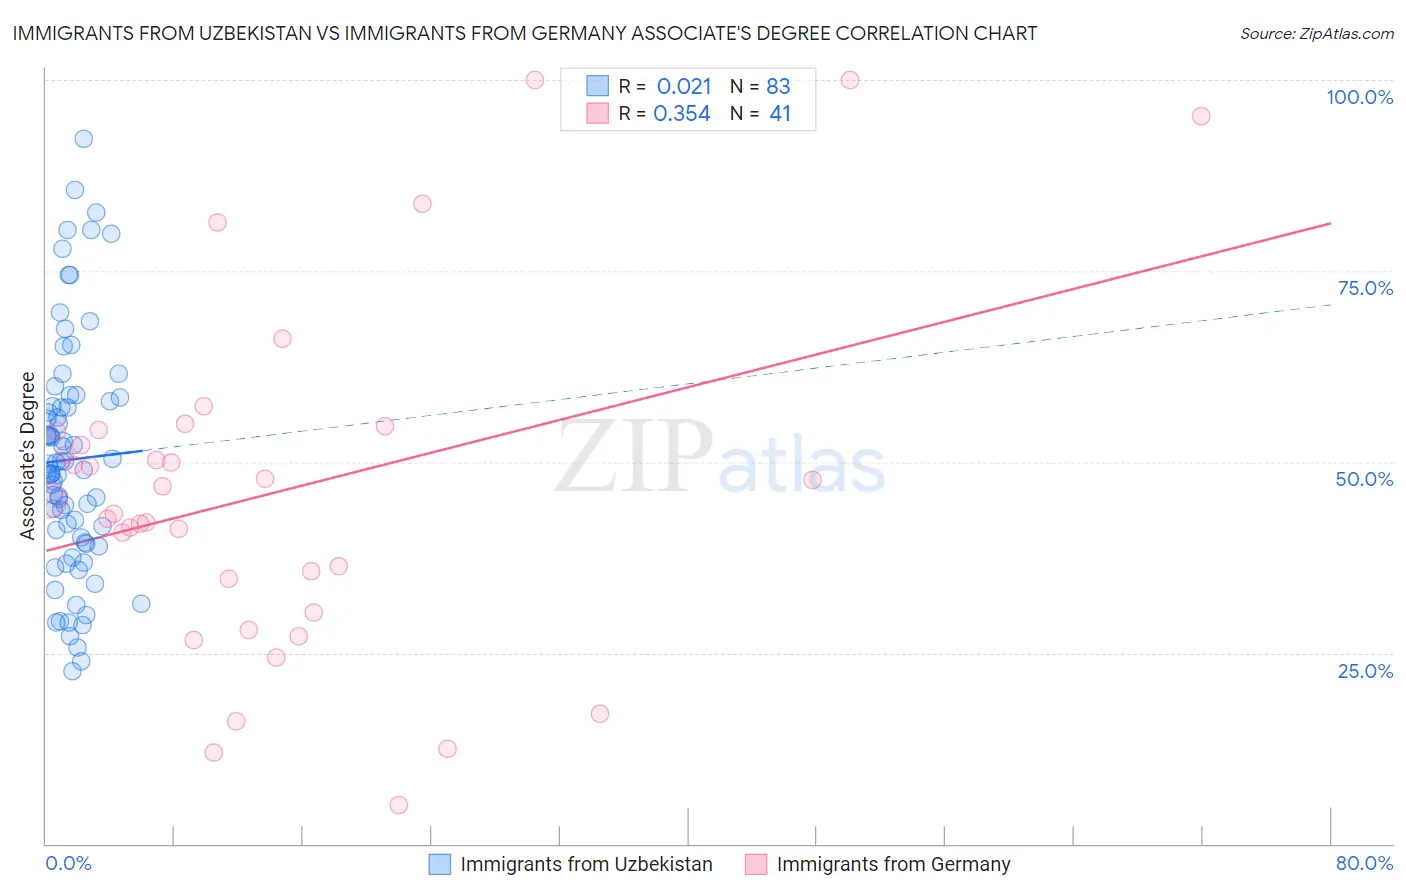
Immigrants from Uzbekistan vs Immigrants from Germany Associate's Degree Correlation Chart
The statistical analysis conducted on geographies consisting of 118,752,495 people shows no correlation between the proportion of Immigrants from Uzbekistan and percentage of population with at least associate's degree education in the United States with a correlation coefficient (R) of 0.021 and weighted average of 50.3%. Similarly, the statistical analysis conducted on geographies consisting of 463,874,369 people shows a mild positive correlation between the proportion of Immigrants from Germany and percentage of population with at least associate's degree education in the United States with a correlation coefficient (R) of 0.354 and weighted average of 47.1%, a difference of 6.8%.
Associate's Degree Correlation Summary
| Measurement | Immigrants from Uzbekistan | Immigrants from Germany |
| Minimum | 22.7% | 5.1% |
| Maximum | 92.3% | 100.0% |
| Range | 69.6% | 94.9% |
| Mean | 50.3% | 46.1% |
| Median | 49.0% | 44.9% |
| Interquartile 25% (IQ1) | 39.4% | 32.5% |
| Interquartile 75% (IQ3) | 57.9% | 54.1% |
| Interquartile Range (IQR) | 18.5% | 21.6% |
| Standard Deviation (Sample) | 15.3% | 22.2% |
| Standard Deviation (Population) | 15.2% | 22.0% |
Similar Demographics by Associate's Degree
Demographics Similar to Immigrants from Uzbekistan by Associate's Degree
In terms of associate's degree, the demographic groups most similar to Immigrants from Uzbekistan are Immigrants from Hungary (50.2%, a difference of 0.020%), Greek (50.3%, a difference of 0.040%), Immigrants from Egypt (50.2%, a difference of 0.070%), Immigrants from Croatia (50.2%, a difference of 0.080%), and Immigrants from Moldova (50.2%, a difference of 0.20%).
| Demographics | Rating | Rank | Associate's Degree |
| Immigrants | Zimbabwe | 99.2 /100 | #76 | Exceptional 50.5% |
| Immigrants | Lebanon | 99.1 /100 | #77 | Exceptional 50.5% |
| Immigrants | Eastern Europe | 99.1 /100 | #78 | Exceptional 50.5% |
| Ethiopians | 99.1 /100 | #79 | Exceptional 50.4% |
| Armenians | 99.1 /100 | #80 | Exceptional 50.4% |
| Maltese | 99.1 /100 | #81 | Exceptional 50.4% |
| Greeks | 98.9 /100 | #82 | Exceptional 50.3% |
| Immigrants | Uzbekistan | 98.9 /100 | #83 | Exceptional 50.3% |
| Immigrants | Hungary | 98.9 /100 | #84 | Exceptional 50.2% |
| Immigrants | Egypt | 98.9 /100 | #85 | Exceptional 50.2% |
| Immigrants | Croatia | 98.9 /100 | #86 | Exceptional 50.2% |
| Immigrants | Moldova | 98.8 /100 | #87 | Exceptional 50.2% |
| Immigrants | Canada | 98.7 /100 | #88 | Exceptional 50.1% |
| Immigrants | Western Europe | 98.7 /100 | #89 | Exceptional 50.1% |
| Immigrants | Ethiopia | 98.7 /100 | #90 | Exceptional 50.1% |
Demographics Similar to Immigrants from Germany by Associate's Degree
In terms of associate's degree, the demographic groups most similar to Immigrants from Germany are Sudanese (47.1%, a difference of 0.040%), Immigrants from Poland (47.1%, a difference of 0.050%), South American (47.1%, a difference of 0.070%), Kenyan (47.1%, a difference of 0.080%), and Immigrants from Kenya (47.2%, a difference of 0.21%).
| Demographics | Rating | Rank | Associate's Degree |
| Immigrants | North Macedonia | 76.0 /100 | #151 | Good 47.4% |
| Immigrants | Afghanistan | 74.3 /100 | #152 | Good 47.3% |
| Czechs | 72.2 /100 | #153 | Good 47.2% |
| Immigrants | Kenya | 72.1 /100 | #154 | Good 47.2% |
| Kenyans | 70.6 /100 | #155 | Good 47.1% |
| South Americans | 70.5 /100 | #156 | Good 47.1% |
| Sudanese | 70.3 /100 | #157 | Good 47.1% |
| Immigrants | Germany | 69.7 /100 | #158 | Good 47.1% |
| Immigrants | Poland | 69.2 /100 | #159 | Good 47.1% |
| Scottish | 65.4 /100 | #160 | Good 46.9% |
| Scandinavians | 65.2 /100 | #161 | Good 46.9% |
| Immigrants | Africa | 63.2 /100 | #162 | Good 46.8% |
| Somalis | 62.5 /100 | #163 | Good 46.8% |
| Colombians | 62.4 /100 | #164 | Good 46.8% |
| Immigrants | South America | 59.9 /100 | #165 | Average 46.7% |