Immigrants from Uzbekistan vs Scottish Single Mother Households
COMPARE
Immigrants from Uzbekistan
Scottish
Single Mother Households
Single Mother Households Comparison
Immigrants from Uzbekistan
Scottish
5.9%
SINGLE MOTHER HOUSEHOLDS
93.4/ 100
METRIC RATING
123rd/ 347
METRIC RANK
5.8%
SINGLE MOTHER HOUSEHOLDS
96.2/ 100
METRIC RATING
103rd/ 347
METRIC RANK
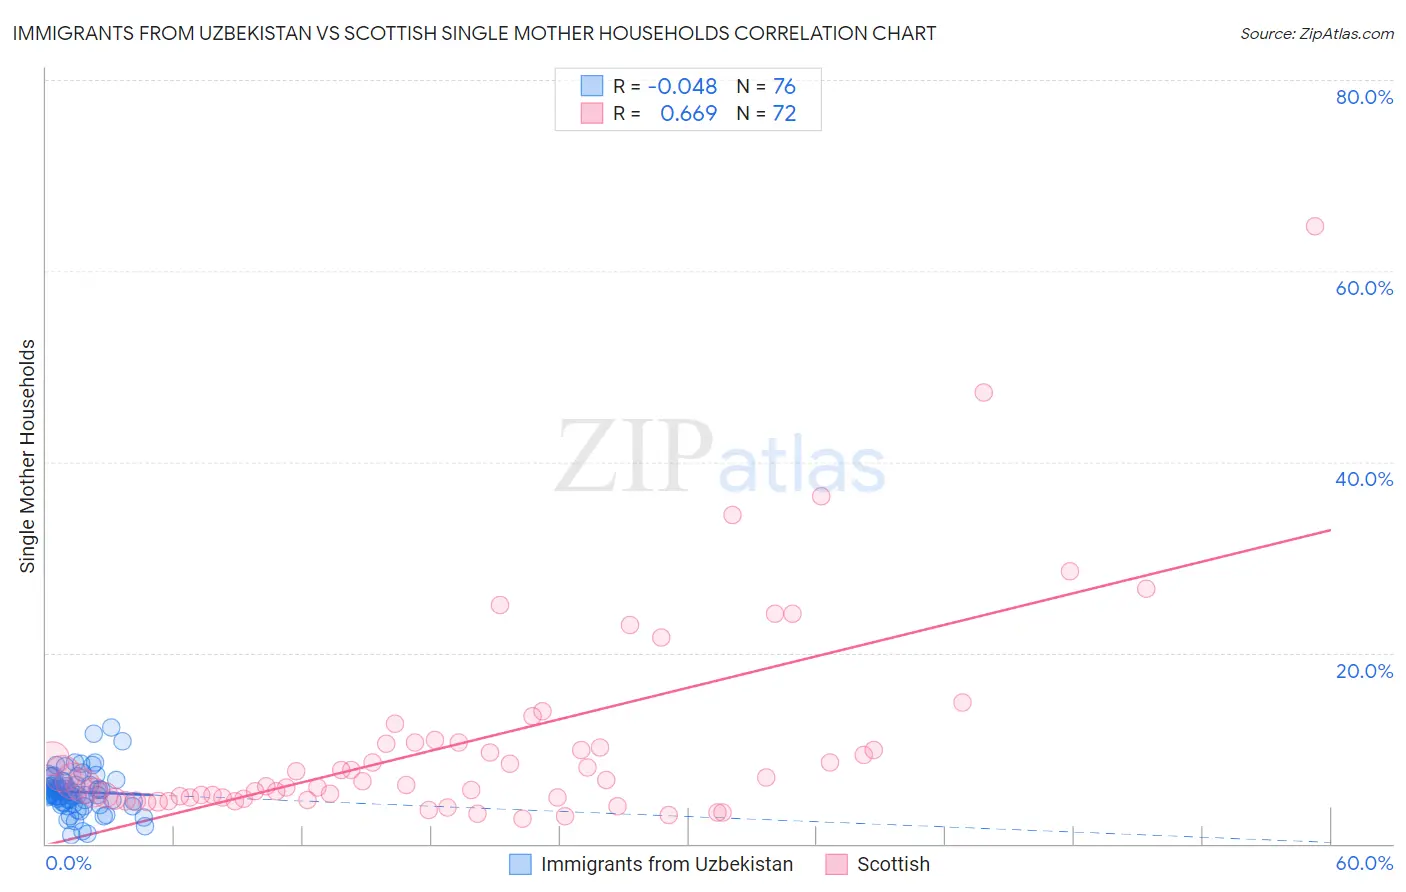
Immigrants from Uzbekistan vs Scottish Single Mother Households Correlation Chart
The statistical analysis conducted on geographies consisting of 118,578,546 people shows no correlation between the proportion of Immigrants from Uzbekistan and percentage of single mother households in the United States with a correlation coefficient (R) of -0.048 and weighted average of 5.9%. Similarly, the statistical analysis conducted on geographies consisting of 561,711,947 people shows a significant positive correlation between the proportion of Scottish and percentage of single mother households in the United States with a correlation coefficient (R) of 0.669 and weighted average of 5.8%, a difference of 1.7%.
Single Mother Households Correlation Summary
| Measurement | Immigrants from Uzbekistan | Scottish |
| Minimum | 0.94% | 2.6% |
| Maximum | 12.2% | 64.7% |
| Range | 11.3% | 62.1% |
| Mean | 5.4% | 10.6% |
| Median | 5.3% | 6.6% |
| Interquartile 25% (IQ1) | 4.3% | 4.8% |
| Interquartile 75% (IQ3) | 6.4% | 10.5% |
| Interquartile Range (IQR) | 2.1% | 5.7% |
| Standard Deviation (Sample) | 2.1% | 10.9% |
| Standard Deviation (Population) | 2.1% | 10.8% |
Demographics Similar to Immigrants from Uzbekistan and Scottish by Single Mother Households
In terms of single mother households, the demographic groups most similar to Immigrants from Uzbekistan are Belgian (5.8%, a difference of 0.060%), Argentinean (5.8%, a difference of 0.14%), Tongan (5.8%, a difference of 0.17%), South African (5.8%, a difference of 0.36%), and Laotian (5.8%, a difference of 0.47%). Similarly, the demographic groups most similar to Scottish are Northern European (5.8%, a difference of 0.010%), Taiwanese (5.8%, a difference of 0.080%), Immigrants from Ukraine (5.8%, a difference of 0.18%), Paraguayan (5.8%, a difference of 0.30%), and Immigrants from Italy (5.8%, a difference of 0.30%).
| Demographics | Rating | Rank | Single Mother Households |
| Scottish | 96.2 /100 | #103 | Exceptional 5.8% |
| Northern Europeans | 96.2 /100 | #104 | Exceptional 5.8% |
| Taiwanese | 96.1 /100 | #105 | Exceptional 5.8% |
| Immigrants | Ukraine | 95.9 /100 | #106 | Exceptional 5.8% |
| Paraguayans | 95.8 /100 | #107 | Exceptional 5.8% |
| Immigrants | Italy | 95.8 /100 | #108 | Exceptional 5.8% |
| Immigrants | Western Europe | 95.7 /100 | #109 | Exceptional 5.8% |
| British | 95.5 /100 | #110 | Exceptional 5.8% |
| Immigrants | England | 95.5 /100 | #111 | Exceptional 5.8% |
| Immigrants | Kuwait | 95.4 /100 | #112 | Exceptional 5.8% |
| Mongolians | 95.3 /100 | #113 | Exceptional 5.8% |
| Dutch | 95.1 /100 | #114 | Exceptional 5.8% |
| Irish | 94.8 /100 | #115 | Exceptional 5.8% |
| Pennsylvania Germans | 94.7 /100 | #116 | Exceptional 5.8% |
| Bolivians | 94.6 /100 | #117 | Exceptional 5.8% |
| Laotians | 94.3 /100 | #118 | Exceptional 5.8% |
| South Africans | 94.1 /100 | #119 | Exceptional 5.8% |
| Tongans | 93.7 /100 | #120 | Exceptional 5.8% |
| Argentineans | 93.7 /100 | #121 | Exceptional 5.8% |
| Belgians | 93.5 /100 | #122 | Exceptional 5.8% |
| Immigrants | Uzbekistan | 93.4 /100 | #123 | Exceptional 5.9% |