Immigrants from Uzbekistan vs Somali Single Mother Households
COMPARE
Immigrants from Uzbekistan
Somali
Single Mother Households
Single Mother Households Comparison
Immigrants from Uzbekistan
Somalis
5.9%
SINGLE MOTHER HOUSEHOLDS
93.4/ 100
METRIC RATING
123rd/ 347
METRIC RANK
7.5%
SINGLE MOTHER HOUSEHOLDS
0.1/ 100
METRIC RATING
269th/ 347
METRIC RANK
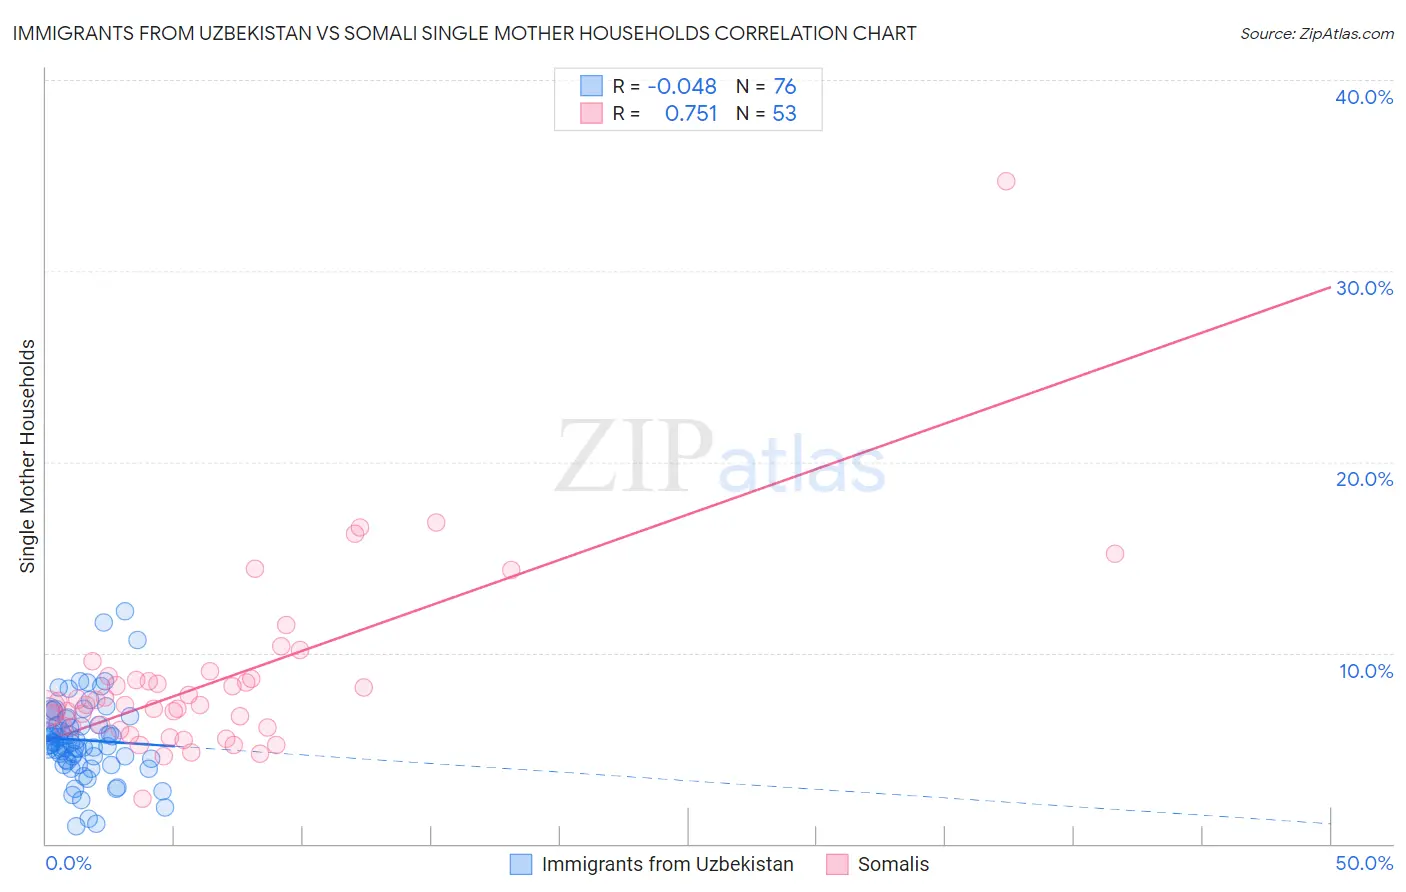
Immigrants from Uzbekistan vs Somali Single Mother Households Correlation Chart
The statistical analysis conducted on geographies consisting of 118,578,546 people shows no correlation between the proportion of Immigrants from Uzbekistan and percentage of single mother households in the United States with a correlation coefficient (R) of -0.048 and weighted average of 5.9%. Similarly, the statistical analysis conducted on geographies consisting of 99,265,723 people shows a strong positive correlation between the proportion of Somalis and percentage of single mother households in the United States with a correlation coefficient (R) of 0.751 and weighted average of 7.5%, a difference of 28.4%.
Single Mother Households Correlation Summary
| Measurement | Immigrants from Uzbekistan | Somali |
| Minimum | 0.94% | 2.4% |
| Maximum | 12.2% | 34.7% |
| Range | 11.3% | 32.3% |
| Mean | 5.4% | 8.6% |
| Median | 5.3% | 7.3% |
| Interquartile 25% (IQ1) | 4.3% | 6.1% |
| Interquartile 75% (IQ3) | 6.4% | 8.7% |
| Interquartile Range (IQR) | 2.1% | 2.6% |
| Standard Deviation (Sample) | 2.1% | 4.8% |
| Standard Deviation (Population) | 2.1% | 4.8% |
Similar Demographics by Single Mother Households
Demographics Similar to Immigrants from Uzbekistan by Single Mother Households
In terms of single mother households, the demographic groups most similar to Immigrants from Uzbekistan are Belgian (5.8%, a difference of 0.060%), Immigrants from Argentina (5.9%, a difference of 0.070%), Argentinean (5.8%, a difference of 0.14%), Tongan (5.8%, a difference of 0.17%), and Slavic (5.9%, a difference of 0.23%).
| Demographics | Rating | Rank | Single Mother Households |
| Pennsylvania Germans | 94.7 /100 | #116 | Exceptional 5.8% |
| Bolivians | 94.6 /100 | #117 | Exceptional 5.8% |
| Laotians | 94.3 /100 | #118 | Exceptional 5.8% |
| South Africans | 94.1 /100 | #119 | Exceptional 5.8% |
| Tongans | 93.7 /100 | #120 | Exceptional 5.8% |
| Argentineans | 93.7 /100 | #121 | Exceptional 5.8% |
| Belgians | 93.5 /100 | #122 | Exceptional 5.8% |
| Immigrants | Uzbekistan | 93.4 /100 | #123 | Exceptional 5.9% |
| Immigrants | Argentina | 93.2 /100 | #124 | Exceptional 5.9% |
| Slavs | 92.9 /100 | #125 | Exceptional 5.9% |
| Welsh | 92.8 /100 | #126 | Exceptional 5.9% |
| Lebanese | 92.4 /100 | #127 | Exceptional 5.9% |
| Czechoslovakians | 92.2 /100 | #128 | Exceptional 5.9% |
| Immigrants | Bolivia | 92.2 /100 | #129 | Exceptional 5.9% |
| Palestinians | 92.1 /100 | #130 | Exceptional 5.9% |
Demographics Similar to Somalis by Single Mother Households
In terms of single mother households, the demographic groups most similar to Somalis are Immigrants from Cuba (7.5%, a difference of 0.16%), Salvadoran (7.5%, a difference of 0.25%), Immigrants from the Azores (7.5%, a difference of 0.25%), Indonesian (7.5%, a difference of 0.41%), and Blackfeet (7.5%, a difference of 0.45%).
| Demographics | Rating | Rank | Single Mother Households |
| Immigrants | Somalia | 0.2 /100 | #262 | Tragic 7.4% |
| Immigrants | Nicaragua | 0.2 /100 | #263 | Tragic 7.4% |
| Yaqui | 0.1 /100 | #264 | Tragic 7.4% |
| Crow | 0.1 /100 | #265 | Tragic 7.4% |
| Nepalese | 0.1 /100 | #266 | Tragic 7.5% |
| Blackfeet | 0.1 /100 | #267 | Tragic 7.5% |
| Indonesians | 0.1 /100 | #268 | Tragic 7.5% |
| Somalis | 0.1 /100 | #269 | Tragic 7.5% |
| Immigrants | Cuba | 0.1 /100 | #270 | Tragic 7.5% |
| Salvadorans | 0.1 /100 | #271 | Tragic 7.5% |
| Immigrants | Azores | 0.1 /100 | #272 | Tragic 7.5% |
| Belizeans | 0.1 /100 | #273 | Tragic 7.6% |
| Immigrants | Guyana | 0.1 /100 | #274 | Tragic 7.6% |
| Central American Indians | 0.1 /100 | #275 | Tragic 7.6% |
| Guyanese | 0.1 /100 | #276 | Tragic 7.6% |