Immigrants from Taiwan vs Australian Currently Married
COMPARE
Immigrants from Taiwan
Australian
Currently Married
Currently Married Comparison
Immigrants from Taiwan
Australians
50.7%
CURRENTLY MARRIED
100.0/ 100
METRIC RATING
4th/ 347
METRIC RANK
47.6%
CURRENTLY MARRIED
90.2/ 100
METRIC RATING
119th/ 347
METRIC RANK
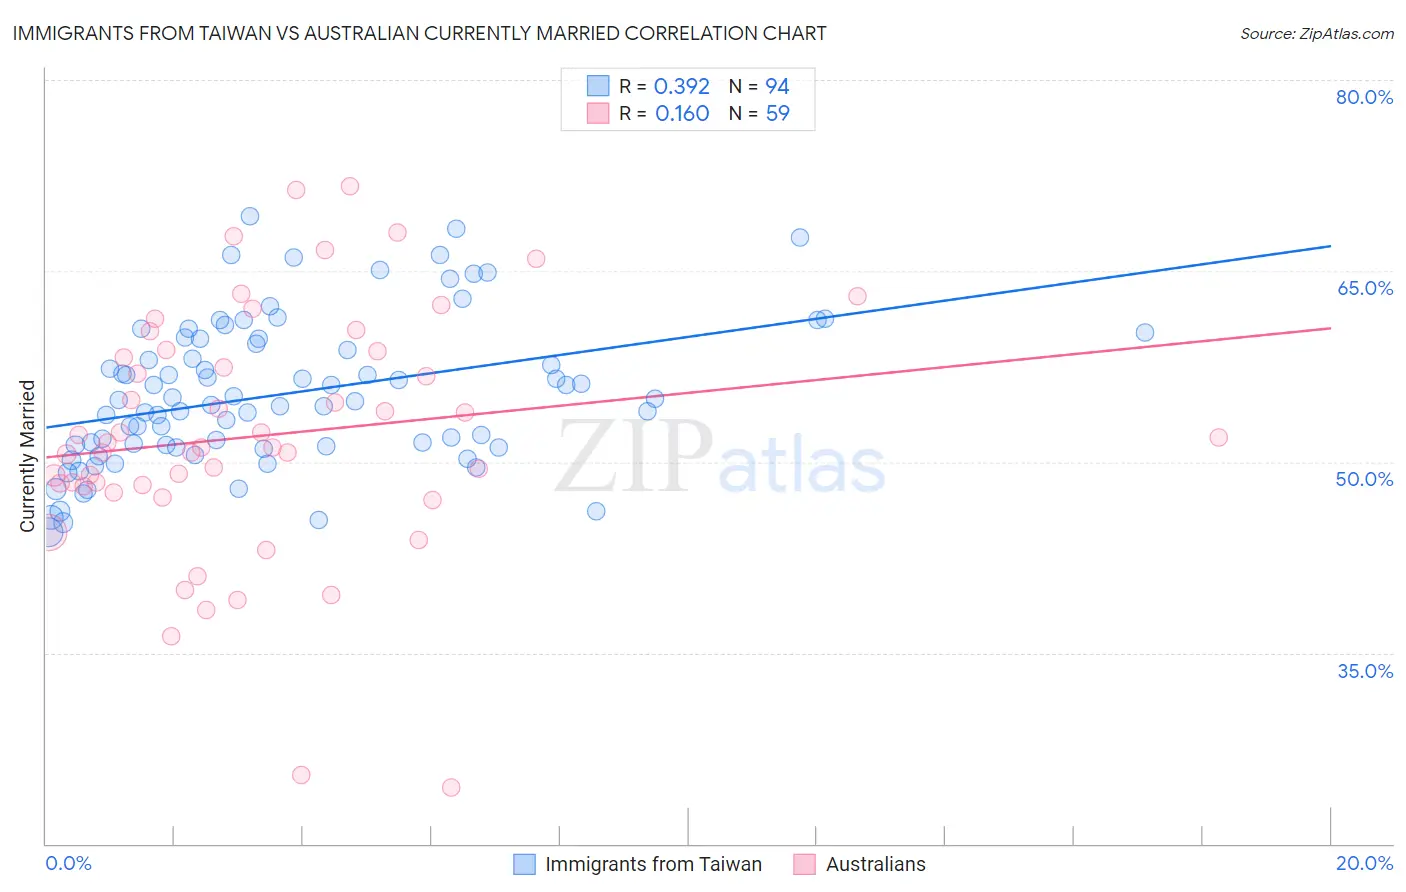
Immigrants from Taiwan vs Australian Currently Married Correlation Chart
The statistical analysis conducted on geographies consisting of 298,249,316 people shows a mild positive correlation between the proportion of Immigrants from Taiwan and percentage of population currently married in the United States with a correlation coefficient (R) of 0.392 and weighted average of 50.7%. Similarly, the statistical analysis conducted on geographies consisting of 224,121,967 people shows a poor positive correlation between the proportion of Australians and percentage of population currently married in the United States with a correlation coefficient (R) of 0.160 and weighted average of 47.6%, a difference of 6.6%.
Currently Married Correlation Summary
| Measurement | Immigrants from Taiwan | Australian |
| Minimum | 44.5% | 24.4% |
| Maximum | 69.2% | 71.6% |
| Range | 24.8% | 47.2% |
| Mean | 55.4% | 52.1% |
| Median | 54.8% | 51.2% |
| Interquartile 25% (IQ1) | 51.2% | 48.1% |
| Interquartile 75% (IQ3) | 59.6% | 58.6% |
| Interquartile Range (IQR) | 8.4% | 10.6% |
| Standard Deviation (Sample) | 5.8% | 9.7% |
| Standard Deviation (Population) | 5.7% | 9.6% |
Similar Demographics by Currently Married
Demographics Similar to Immigrants from Taiwan by Currently Married
In terms of currently married, the demographic groups most similar to Immigrants from Taiwan are Assyrian/Chaldean/Syriac (50.8%, a difference of 0.080%), Thai (50.9%, a difference of 0.26%), Danish (50.5%, a difference of 0.55%), Norwegian (50.2%, a difference of 1.1%), and Immigrants from South Central Asia (50.0%, a difference of 1.4%).
| Demographics | Rating | Rank | Currently Married |
| Immigrants | India | 100.0 /100 | #1 | Exceptional 51.8% |
| Thais | 100.0 /100 | #2 | Exceptional 50.9% |
| Assyrians/Chaldeans/Syriacs | 100.0 /100 | #3 | Exceptional 50.8% |
| Immigrants | Taiwan | 100.0 /100 | #4 | Exceptional 50.7% |
| Danes | 100.0 /100 | #5 | Exceptional 50.5% |
| Norwegians | 100.0 /100 | #6 | Exceptional 50.2% |
| Immigrants | South Central Asia | 100.0 /100 | #7 | Exceptional 50.0% |
| Swedes | 100.0 /100 | #8 | Exceptional 50.0% |
| Czechs | 99.9 /100 | #9 | Exceptional 49.9% |
| Filipinos | 99.9 /100 | #10 | Exceptional 49.7% |
| English | 99.9 /100 | #11 | Exceptional 49.7% |
| Swiss | 99.9 /100 | #12 | Exceptional 49.7% |
| Dutch | 99.9 /100 | #13 | Exceptional 49.6% |
| Germans | 99.9 /100 | #14 | Exceptional 49.6% |
| Pennsylvania Germans | 99.9 /100 | #15 | Exceptional 49.6% |
Demographics Similar to Australians by Currently Married
In terms of currently married, the demographic groups most similar to Australians are Immigrants from Philippines (47.6%, a difference of 0.0%), Puget Sound Salish (47.6%, a difference of 0.010%), Palestinian (47.6%, a difference of 0.020%), Immigrants from Indonesia (47.6%, a difference of 0.030%), and South African (47.6%, a difference of 0.040%).
| Demographics | Rating | Rank | Currently Married |
| Immigrants | Western Europe | 91.1 /100 | #112 | Exceptional 47.6% |
| Immigrants | Denmark | 90.9 /100 | #113 | Exceptional 47.6% |
| South Africans | 90.5 /100 | #114 | Exceptional 47.6% |
| Immigrants | Indonesia | 90.5 /100 | #115 | Exceptional 47.6% |
| Palestinians | 90.4 /100 | #116 | Exceptional 47.6% |
| Puget Sound Salish | 90.3 /100 | #117 | Exceptional 47.6% |
| Immigrants | Philippines | 90.2 /100 | #118 | Exceptional 47.6% |
| Australians | 90.2 /100 | #119 | Exceptional 47.6% |
| Syrians | 88.9 /100 | #120 | Excellent 47.5% |
| Immigrants | Croatia | 88.6 /100 | #121 | Excellent 47.5% |
| Osage | 87.9 /100 | #122 | Excellent 47.5% |
| Immigrants | Kazakhstan | 87.2 /100 | #123 | Excellent 47.4% |
| Laotians | 86.6 /100 | #124 | Excellent 47.4% |
| Okinawans | 85.3 /100 | #125 | Excellent 47.4% |
| Immigrants | Jordan | 84.9 /100 | #126 | Excellent 47.4% |