Guamanian/Chamorro vs Australian Currently Married
COMPARE
Guamanian/Chamorro
Australian
Currently Married
Currently Married Comparison
Guamanians/Chamorros
Australians
47.1%
CURRENTLY MARRIED
74.2/ 100
METRIC RATING
143rd/ 347
METRIC RANK
47.6%
CURRENTLY MARRIED
90.2/ 100
METRIC RATING
119th/ 347
METRIC RANK
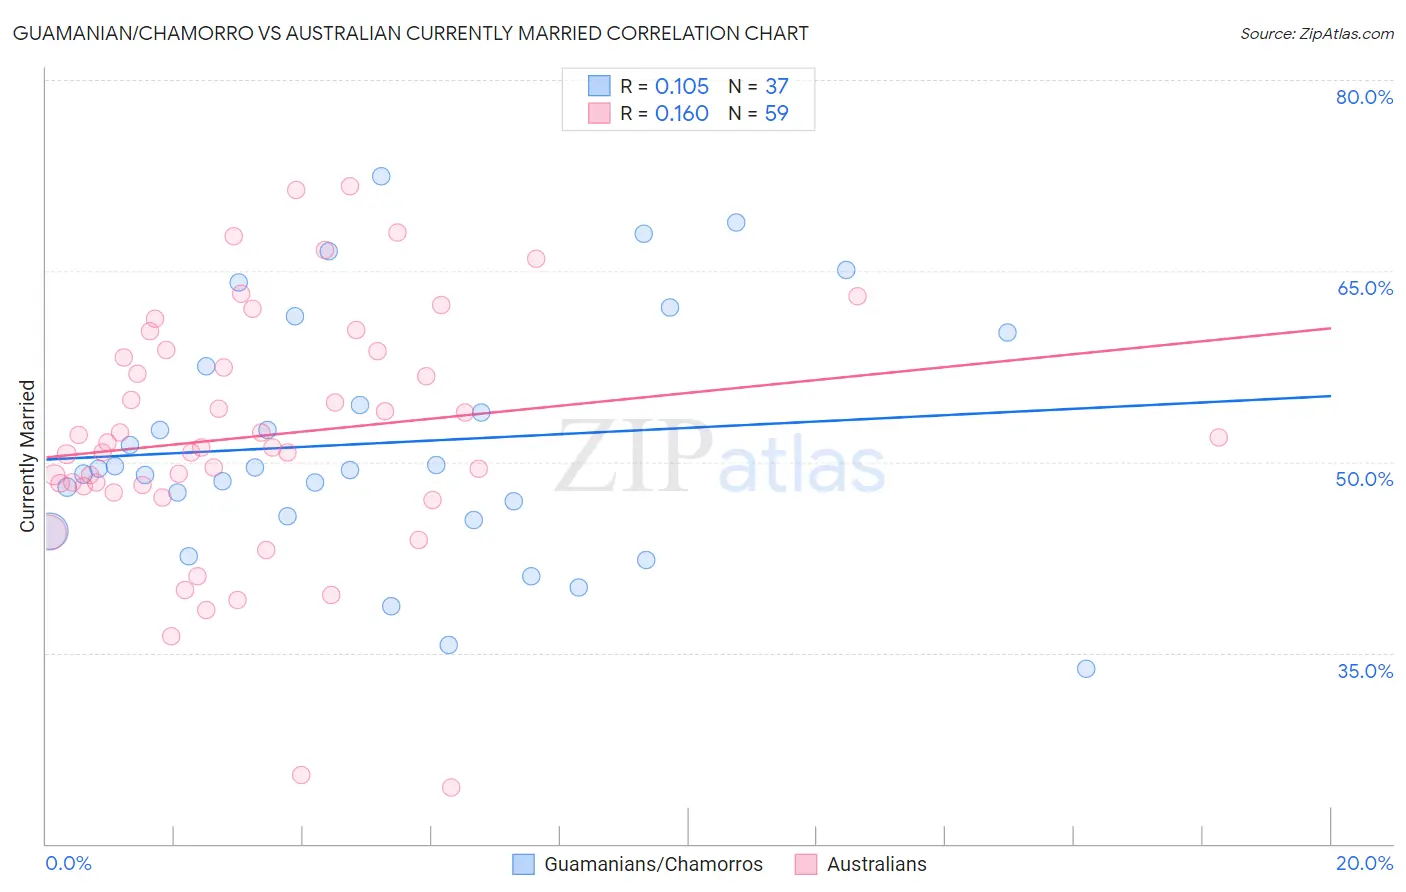
Guamanian/Chamorro vs Australian Currently Married Correlation Chart
The statistical analysis conducted on geographies consisting of 221,951,395 people shows a poor positive correlation between the proportion of Guamanians/Chamorros and percentage of population currently married in the United States with a correlation coefficient (R) of 0.105 and weighted average of 47.1%. Similarly, the statistical analysis conducted on geographies consisting of 224,121,967 people shows a poor positive correlation between the proportion of Australians and percentage of population currently married in the United States with a correlation coefficient (R) of 0.160 and weighted average of 47.6%, a difference of 1.1%.
Currently Married Correlation Summary
| Measurement | Guamanian/Chamorro | Australian |
| Minimum | 33.7% | 24.4% |
| Maximum | 72.4% | 71.6% |
| Range | 38.7% | 47.2% |
| Mean | 51.5% | 52.1% |
| Median | 49.5% | 51.2% |
| Interquartile 25% (IQ1) | 45.6% | 48.1% |
| Interquartile 75% (IQ3) | 58.9% | 58.6% |
| Interquartile Range (IQR) | 13.3% | 10.6% |
| Standard Deviation (Sample) | 9.5% | 9.7% |
| Standard Deviation (Population) | 9.4% | 9.6% |
Similar Demographics by Currently Married
Demographics Similar to Guamanians/Chamorros by Currently Married
In terms of currently married, the demographic groups most similar to Guamanians/Chamorros are Venezuelan (47.1%, a difference of 0.010%), Argentinean (47.1%, a difference of 0.010%), Hmong (47.1%, a difference of 0.040%), Cajun (47.1%, a difference of 0.050%), and Immigrants from South Eastern Asia (47.1%, a difference of 0.060%).
| Demographics | Rating | Rank | Currently Married |
| Immigrants | Vietnam | 78.2 /100 | #136 | Good 47.2% |
| Paraguayans | 77.8 /100 | #137 | Good 47.2% |
| Pakistanis | 77.5 /100 | #138 | Good 47.2% |
| Yugoslavians | 77.4 /100 | #139 | Good 47.2% |
| Cajuns | 75.3 /100 | #140 | Good 47.1% |
| Venezuelans | 74.4 /100 | #141 | Good 47.1% |
| Argentineans | 74.4 /100 | #142 | Good 47.1% |
| Guamanians/Chamorros | 74.2 /100 | #143 | Good 47.1% |
| Hmong | 73.4 /100 | #144 | Good 47.1% |
| Immigrants | South Eastern Asia | 72.9 /100 | #145 | Good 47.1% |
| Carpatho Rusyns | 72.6 /100 | #146 | Good 47.0% |
| Immigrants | Argentina | 72.0 /100 | #147 | Good 47.0% |
| Cambodians | 70.4 /100 | #148 | Good 47.0% |
| Zimbabweans | 70.1 /100 | #149 | Good 47.0% |
| Immigrants | Turkey | 70.0 /100 | #150 | Good 47.0% |
Demographics Similar to Australians by Currently Married
In terms of currently married, the demographic groups most similar to Australians are Immigrants from Philippines (47.6%, a difference of 0.0%), Puget Sound Salish (47.6%, a difference of 0.010%), Palestinian (47.6%, a difference of 0.020%), Immigrants from Indonesia (47.6%, a difference of 0.030%), and South African (47.6%, a difference of 0.040%).
| Demographics | Rating | Rank | Currently Married |
| Immigrants | Western Europe | 91.1 /100 | #112 | Exceptional 47.6% |
| Immigrants | Denmark | 90.9 /100 | #113 | Exceptional 47.6% |
| South Africans | 90.5 /100 | #114 | Exceptional 47.6% |
| Immigrants | Indonesia | 90.5 /100 | #115 | Exceptional 47.6% |
| Palestinians | 90.4 /100 | #116 | Exceptional 47.6% |
| Puget Sound Salish | 90.3 /100 | #117 | Exceptional 47.6% |
| Immigrants | Philippines | 90.2 /100 | #118 | Exceptional 47.6% |
| Australians | 90.2 /100 | #119 | Exceptional 47.6% |
| Syrians | 88.9 /100 | #120 | Excellent 47.5% |
| Immigrants | Croatia | 88.6 /100 | #121 | Excellent 47.5% |
| Osage | 87.9 /100 | #122 | Excellent 47.5% |
| Immigrants | Kazakhstan | 87.2 /100 | #123 | Excellent 47.4% |
| Laotians | 86.6 /100 | #124 | Excellent 47.4% |
| Okinawans | 85.3 /100 | #125 | Excellent 47.4% |
| Immigrants | Jordan | 84.9 /100 | #126 | Excellent 47.4% |