Immigrants from Taiwan vs Immigrants from France Currently Married
COMPARE
Immigrants from Taiwan
Immigrants from France
Currently Married
Currently Married Comparison
Immigrants from Taiwan
Immigrants from France
50.7%
CURRENTLY MARRIED
100.0/ 100
METRIC RATING
4th/ 347
METRIC RANK
46.2%
CURRENTLY MARRIED
27.7/ 100
METRIC RATING
191st/ 347
METRIC RANK
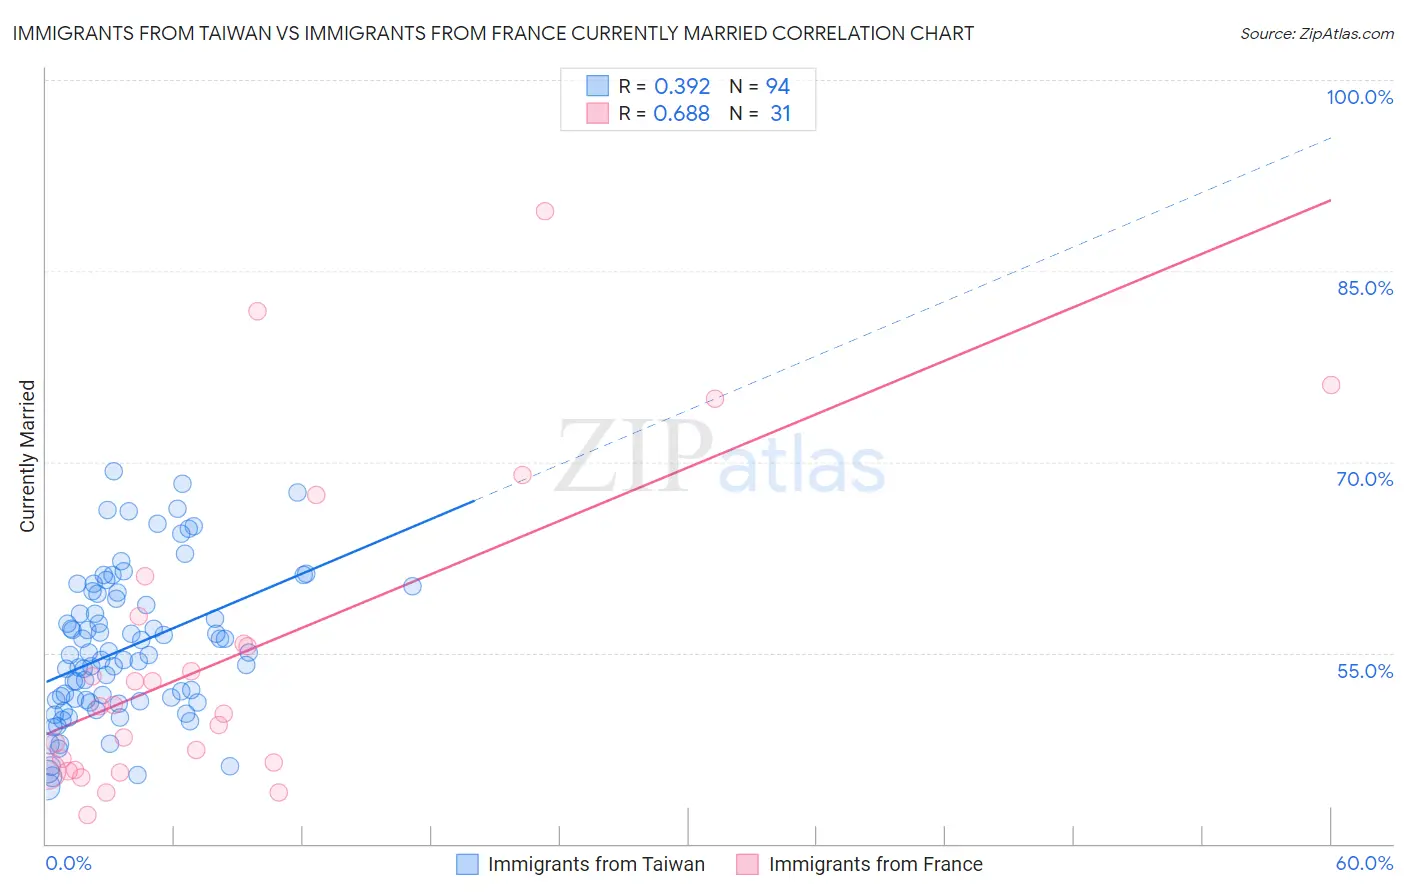
Immigrants from Taiwan vs Immigrants from France Currently Married Correlation Chart
The statistical analysis conducted on geographies consisting of 298,249,316 people shows a mild positive correlation between the proportion of Immigrants from Taiwan and percentage of population currently married in the United States with a correlation coefficient (R) of 0.392 and weighted average of 50.7%. Similarly, the statistical analysis conducted on geographies consisting of 287,900,584 people shows a significant positive correlation between the proportion of Immigrants from France and percentage of population currently married in the United States with a correlation coefficient (R) of 0.688 and weighted average of 46.2%, a difference of 9.8%.
Currently Married Correlation Summary
| Measurement | Immigrants from Taiwan | Immigrants from France |
| Minimum | 44.5% | 42.2% |
| Maximum | 69.2% | 89.7% |
| Range | 24.8% | 47.5% |
| Mean | 55.4% | 54.8% |
| Median | 54.8% | 50.8% |
| Interquartile 25% (IQ1) | 51.2% | 45.8% |
| Interquartile 75% (IQ3) | 59.6% | 57.9% |
| Interquartile Range (IQR) | 8.4% | 12.1% |
| Standard Deviation (Sample) | 5.8% | 12.1% |
| Standard Deviation (Population) | 5.7% | 11.9% |
Similar Demographics by Currently Married
Demographics Similar to Immigrants from Taiwan by Currently Married
In terms of currently married, the demographic groups most similar to Immigrants from Taiwan are Assyrian/Chaldean/Syriac (50.8%, a difference of 0.080%), Thai (50.9%, a difference of 0.26%), Danish (50.5%, a difference of 0.55%), Norwegian (50.2%, a difference of 1.1%), and Immigrants from South Central Asia (50.0%, a difference of 1.4%).
| Demographics | Rating | Rank | Currently Married |
| Immigrants | India | 100.0 /100 | #1 | Exceptional 51.8% |
| Thais | 100.0 /100 | #2 | Exceptional 50.9% |
| Assyrians/Chaldeans/Syriacs | 100.0 /100 | #3 | Exceptional 50.8% |
| Immigrants | Taiwan | 100.0 /100 | #4 | Exceptional 50.7% |
| Danes | 100.0 /100 | #5 | Exceptional 50.5% |
| Norwegians | 100.0 /100 | #6 | Exceptional 50.2% |
| Immigrants | South Central Asia | 100.0 /100 | #7 | Exceptional 50.0% |
| Swedes | 100.0 /100 | #8 | Exceptional 50.0% |
| Czechs | 99.9 /100 | #9 | Exceptional 49.9% |
| Filipinos | 99.9 /100 | #10 | Exceptional 49.7% |
| English | 99.9 /100 | #11 | Exceptional 49.7% |
| Swiss | 99.9 /100 | #12 | Exceptional 49.7% |
| Dutch | 99.9 /100 | #13 | Exceptional 49.6% |
| Germans | 99.9 /100 | #14 | Exceptional 49.6% |
| Pennsylvania Germans | 99.9 /100 | #15 | Exceptional 49.6% |
Demographics Similar to Immigrants from France by Currently Married
In terms of currently married, the demographic groups most similar to Immigrants from France are Choctaw (46.3%, a difference of 0.060%), Soviet Union (46.2%, a difference of 0.090%), Fijian (46.3%, a difference of 0.12%), Immigrants from Fiji (46.2%, a difference of 0.13%), and Colombian (46.3%, a difference of 0.18%).
| Demographics | Rating | Rank | Currently Married |
| Brazilians | 39.3 /100 | #184 | Fair 46.4% |
| Mongolians | 37.6 /100 | #185 | Fair 46.4% |
| Immigrants | Chile | 36.8 /100 | #186 | Fair 46.4% |
| Immigrants | Peru | 35.3 /100 | #187 | Fair 46.4% |
| Colombians | 31.8 /100 | #188 | Fair 46.3% |
| Fijians | 30.3 /100 | #189 | Fair 46.3% |
| Choctaw | 29.1 /100 | #190 | Fair 46.3% |
| Immigrants | France | 27.7 /100 | #191 | Fair 46.2% |
| Soviet Union | 25.7 /100 | #192 | Fair 46.2% |
| Immigrants | Fiji | 25.0 /100 | #193 | Fair 46.2% |
| South Americans | 23.8 /100 | #194 | Fair 46.1% |
| Immigrants | Nepal | 23.7 /100 | #195 | Fair 46.1% |
| Immigrants | Bosnia and Herzegovina | 22.2 /100 | #196 | Fair 46.1% |
| Immigrants | Kuwait | 21.7 /100 | #197 | Fair 46.1% |
| Immigrants | Colombia | 21.0 /100 | #198 | Fair 46.1% |